Hi there,
I have a report that is creating a bar chart based on the weekly hierarchy in the Time dimension. Several report viewers have mentioned that chart readability would be improved if the date shown was just MMM DD instead of WW, MMM DD YYYY (the chart is viewed in a dashboard where space is at a premium).
e.g. in the table view, instead of this:
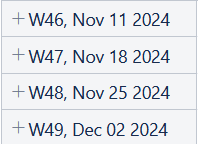
have this instead:

Has anyone figured out a way to do this?
Hi @chrispy35
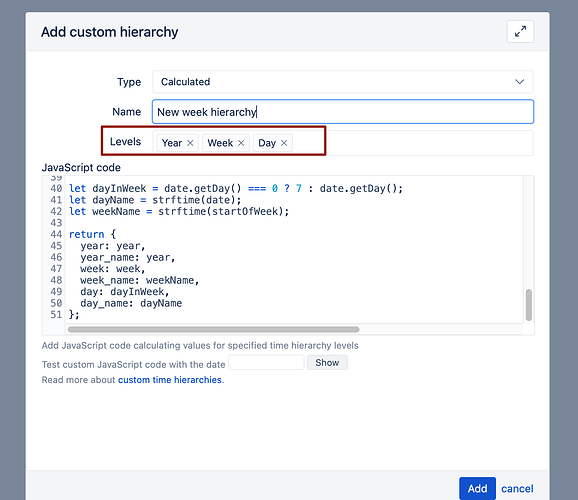
You can try creating a custom Time hierarchy:
https://docs.eazybi.com/eazybi/analyze-and-visualize/custom-time-hierarchies
This is the JS code you can try to show week names shorter:
Martins / eazyBI
let date = new Date(timeValue);

let getWeekNumber = function(date) {
  let target = new Date(date.valueOf());
  let dayNr = (date.getUTCDay() + 6) % 7;
  target.setDate(target.getDate() - dayNr + 3);
  let firstThursday = target.valueOf();
  target.setMonth(0, 1);
  if (target.getDay() !== 4) {
    target.setMonth(0, 1 + ((4 - target.getDay()) + 7) % 7);
  }
  let weekNumber = 1 + Math.ceil((firstThursday - target) / 604800000);
  return weekNumber;
};

let getStartOfWeek = function(date) {
  let day = date.getDay();
  let diff = date.getDate() - (day === 0 ? 6 : day - 1);
  let startOfWeek = new Date(date);
  startOfWeek.setDate(diff);
  return startOfWeek;
};

let strftime = function(date) {
  let months = ["Jan", "Feb", "Mar", "Apr", "May", "Jun", "Jul", "Aug", "Sep", "Oct", "Nov", "Dec"];
  let month = months[date.getMonth()];
  let day = date.getDate();
  let year = date.getFullYear();
  return month + " " + day + ", " + year;
};

let week = getWeekNumber(date);
let startOfWeek = getStartOfWeek(new Date(date));
let startOfWeekYear = startOfWeek.getFullYear();

// Adjust year based on the ISO week number and start of the week year
let year = (startOfWeek.getMonth() === 11 && week === 1) ? startOfWeek.getFullYear() + 1 :
             (startOfWeek.getMonth() === 0 && week > 50) ? startOfWeek.getFullYear() - 1 : startOfWeek.getFullYear();

let dayInWeek = date.getDay() === 0 ? 7 : date.getDay();
let dayName = strftime(date);
let weekName = strftime(startOfWeek);

return {
  year: year,
  year_name: year,
  week: week,
  week_name: weekName,
  day: dayInWeek,
  day_name: dayName
};
Thanks Martin. The week displayed is much more concise but I notice some strange behaviour that I’m wondering if you could comment on:
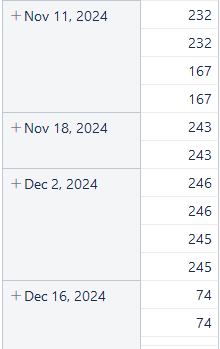
- When I have Week selected in the time hierarchy in the new calculated hierarchy, I observe multiple rows per week in the table.
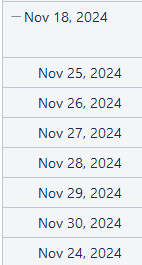
- When I expand the week, the first day of the week is at the bottom of the list (i.e. the days are not in correct order).
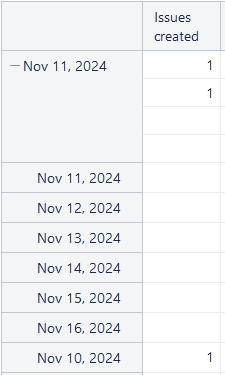
- Some weeks are missing.
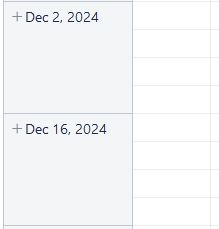
Any ideas for debug?
Hi @chrispy35
I’m wondering if you added the correct levels when defining the calculated hierarchy for Time dimension. This custom week hierarchy won’t work with quarter and month levels.
Feel free to delete this hierarchy from Time dimension menu and create it again with these 3 levels and the same JS code.
Hi Martins,
I had just those levels selected when I checked but I went ahead and deleted/recreated the custom hierarchy and results are the same.
Chris P.
There are some other strange results too. Some weeks are not showing and some are showing with the incorrect days underneath:
Hi @chrispy35
This looks very strange.
Please contact support@eazybi.com and provide your report definition and screenshots from the steps when creating this hierarchy, as well as additional details - if you have other data cubes in the same eazyBI account and your Jira source application exported to a file.
We would love to debug this case as we can’t guess what went wrong here.
Martins / eazyBI


