Hi, I want to create report like this,
how to get version description?
Hi @Rika_Mandasari,
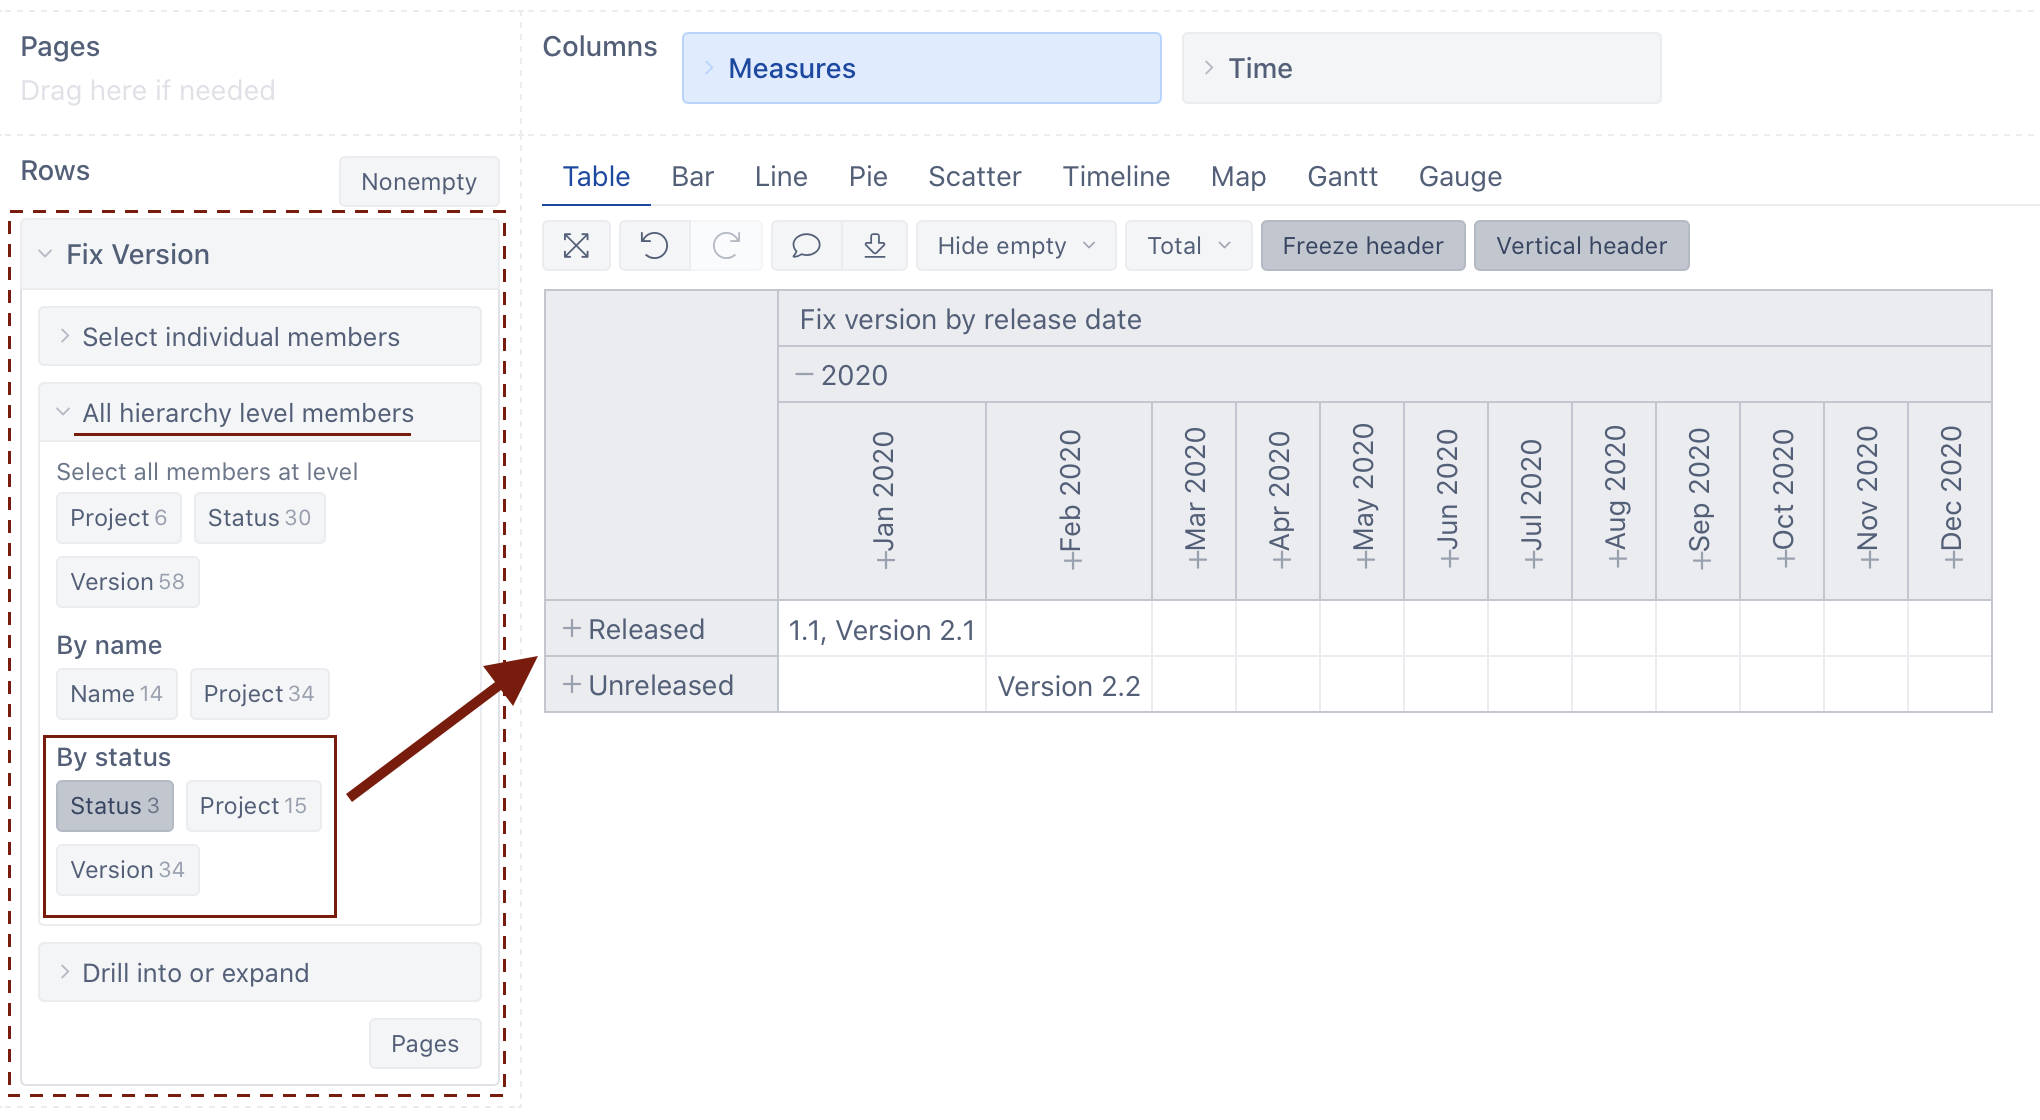
To create this report, please try adding the Fix Version dimension to rows and select the “By Status” hierarchy in the dimension “All hierarchy level members” section.
After that, try creating a new calculated measure in Measures with the formula below:
Generate(
  Filter([Fix Version].[Version].Members,
    ([Measures].[Issues created], [Time].CurrentHierarchy.DefaultMember) > 0
    AND
    DateInPeriod(
      [Fix Version].CurrentMember.get('Release date'),
      [Time].CurrentHierarchyMember
    )
  ),
[Fix Version].CurrentHierarchyMember.GetString('Description'),
", "
)
It will display the Fix version descriptions, which should be released in the Time dimension period currently in columns. Please have a look at the picture of a sample report below:
Please have a look at our documentation page for more information on calculated measures - https://docs.eazybi.com/eazybijira/analyze-and-visualize/calculated-measures-and-members.
Best,
Roberts // support@eazybi.com
This solution works great for me. I was looking to extract the description of the Fix Version on a Time Dimension line chart so this is perfect.
However I am stuck on my next steps which I hope you can help with.
In our system we store the DCUT date for releases in the Description. Which is typically 4 weeks before the Release Date. I updated your code to extract the Date String, which is the last 10 characters of the description.
right([Fix Version].CurrentHierarchyMember.GetString(‘Description’),10),
This extracts the date string correctly but it is still associated with the Time dimension of the Fix Version. Is there any way that I can “shift” this column to the time dimension based on the extracted DCUT date. Or is that not possible?
Any other suggestions.
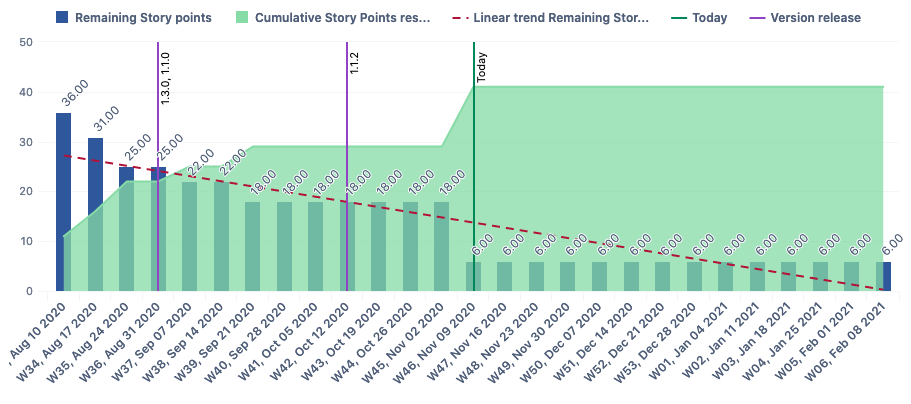
The following is my current chart. “Version release” 1.1.2 is in Oct and displayed as a vertical line. I have extracted the DCUT date from the Fix Version Release which is in September. I want to be able to graph this and tract work to this line. Is this possible?
Thanks
Hi @clarechawke,
To display the release name on the date extracted from the release description, you can define a new calculated measure with a formula similar to the one below:
Generate(
  Filter([Fix Version].[Version].Members,
    ([Measures].[Issues created], [Time].CurrentHierarchy.DefaultMember) > 0
    AND
    DateInPeriod(
       -- Get last 10 characters from Release description and transform it to a date
      DateParse(Right([Fix Version].CurrentHierarchyMember.GetString('Description'), 10)),
      [Time].CurrentHierarchyMember
    )
  ),
  [Fix Version].CurrentMember.Name,
  ", "
)
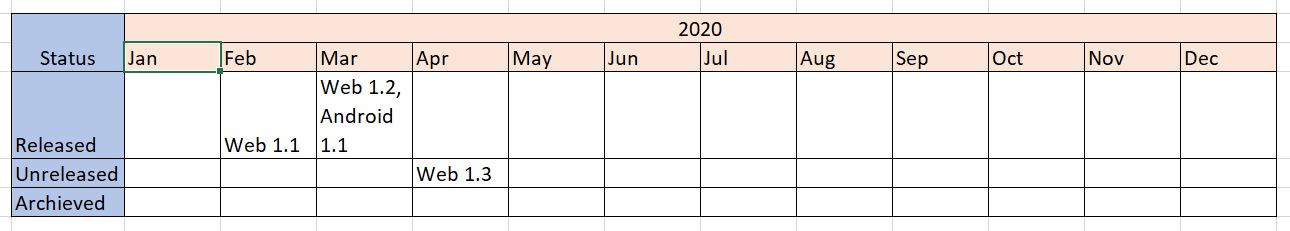
See the comment inside the DateInPeriod() function. Ensure the DateParse() function can transform the date you specify in the Release description from string to a date. Otherwise, the results will be empty. See how it could look in a report below:
See more details on the DateParse() function here - https://docs.eazybi.com/eazybi/analyze-and-visualize/calculated-measures-and-members/mdx-function-reference/dateparse.
Best,
Roberts // support@eazybi.com
Thanks @roberts.cacus. this is exactly what I needed. I’ll probably append the string “DCUT” to the end of the version name, just to call it out but besides that it fixes my issue perfectly.
Thank you.
Clare