Hello,
I am trying to calculate the number of issues deployed in a given two week time period with specific start and end dates.
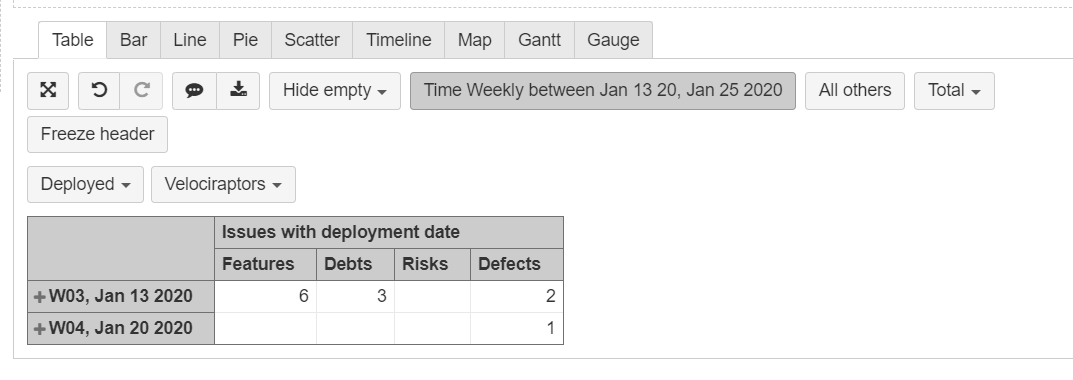
I have selected “Issues with deployment date” as a Column measure.
I have selected All Times on the Time Dimension’s week hierarchy level - which is selected as a Row.
I added a time filter to filter between two given dates “Time between Dec 29 2019, Jan 12 2020”
I get the below table with right number of issues per week.
But my requirement is to combine these two rows (weeks) into one so that I can create a chart for each biweekly iterations.
Is there a way to do this using a calculated member or measure , could you please help ?
We are doing a POC and would like to figure this out so that we can go ahead with this tool ASAP.
Thank you for the help in advance.
Karthiga Sethuraj.
Hi @Karthiga_Sethuraj,
sorry for the delayed answer!
For biweekly report example please check our demo report here - https://eazybi.com/accounts/1000/cubes/Issues/reports/103084-issues-created-bi-weekly
This report has measure Time week number that shows value 1 for odd weeks and value 0 for even weeks, depending on your report context you can filter weeks.
Then you can check measure Issues created within two weeks that shows you issues created in this and last week and also measure Issues created for this and next week that shows you issues created in this week and next one. Based on those examples you can create a formula to calculate data you are interested in.
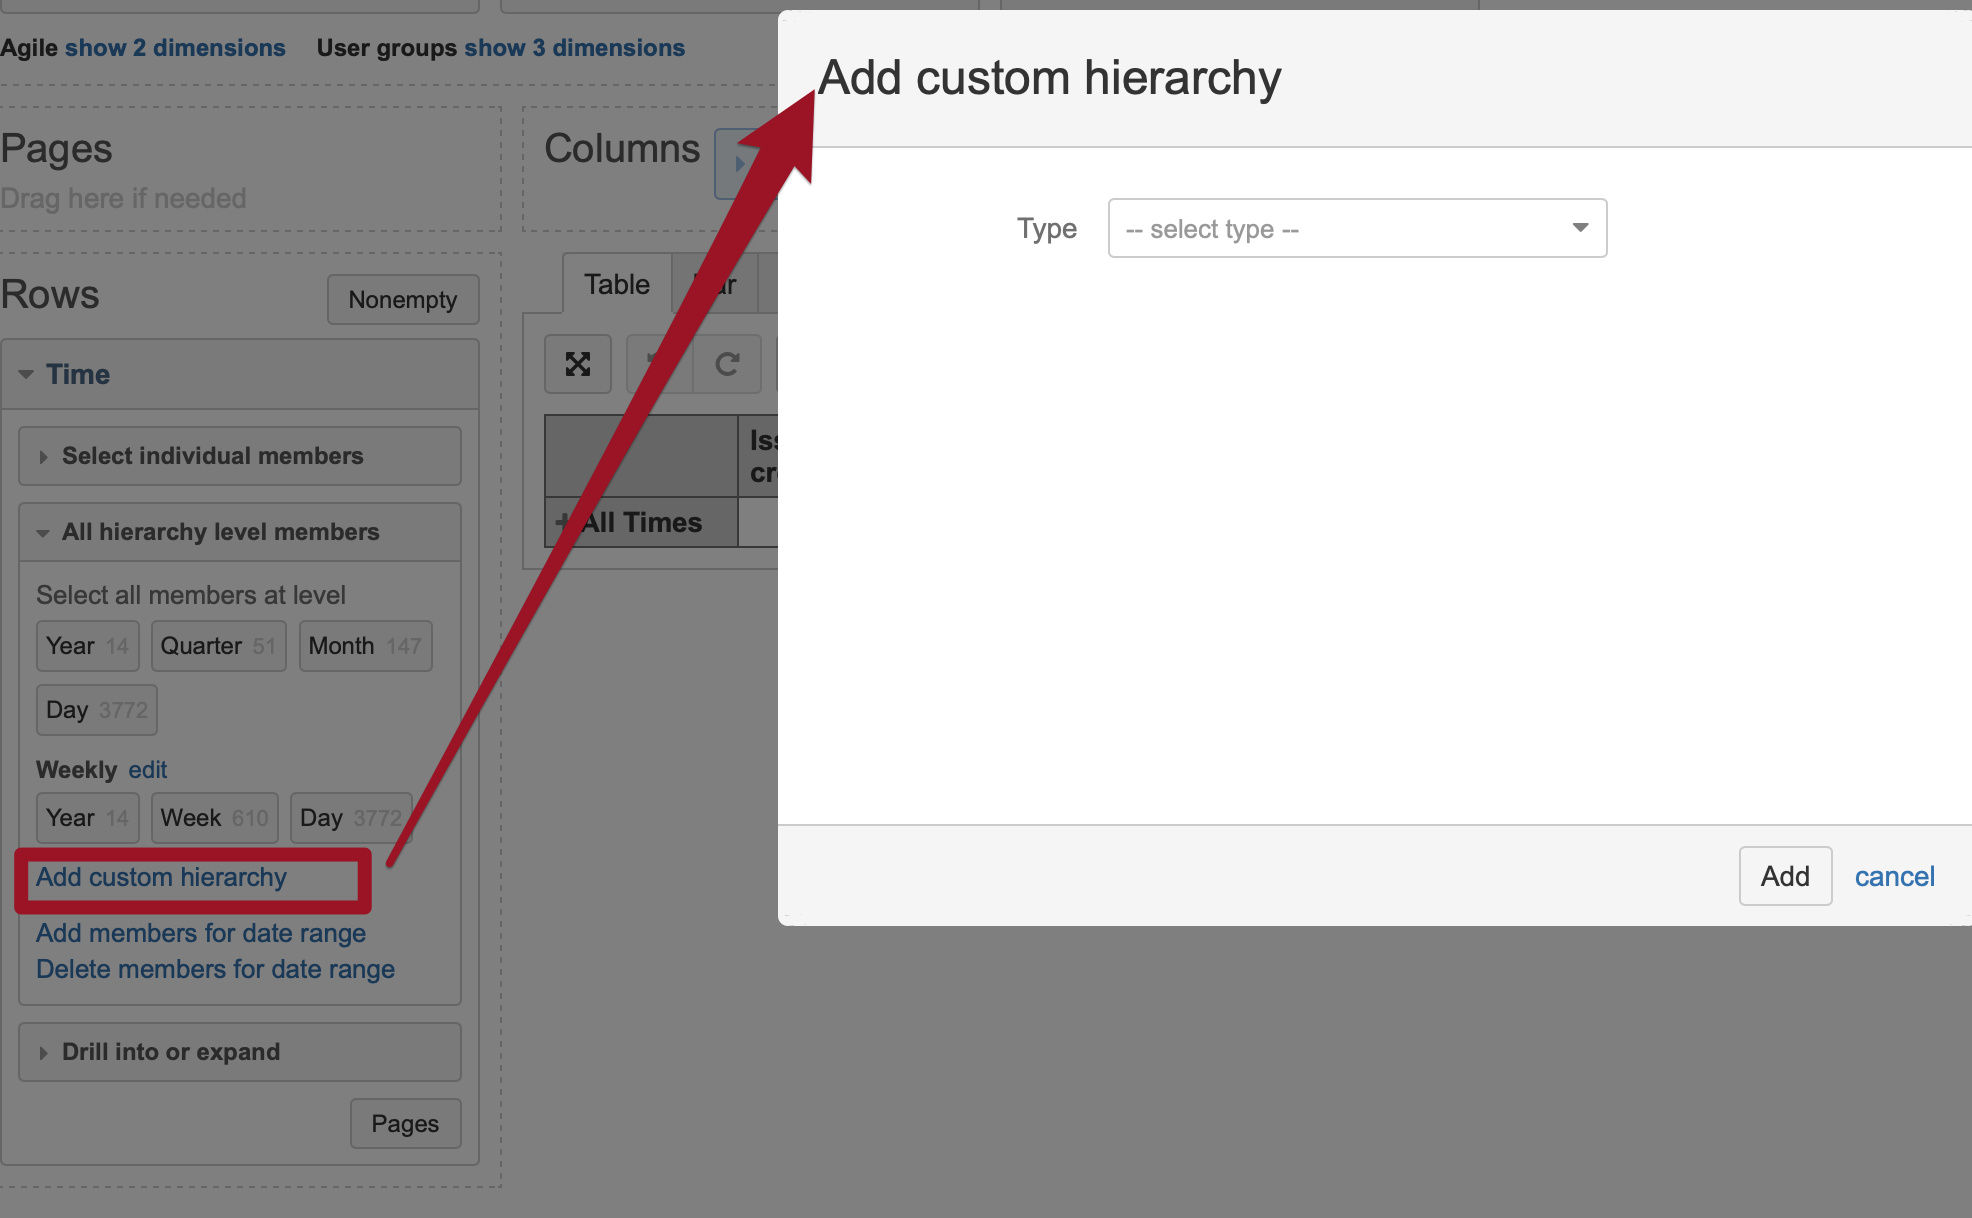
Currently, we are working on eazyBI newest version 5.3. and in this version, we will deploy the possibility to add custom hierarchy into the Time dimension (this version already is available in eazyBI for Jira Cloud). Please follow our changelog to get information when it will be available for server version - https://marketplace.atlassian.com/apps/1211051/eazybi-reports-and-charts-for-jira/version-history )
best,
Gerda // support@eazybi.com
Thank you. Appreciate your response. This is helpful!
This is great! I’m trying to leverage this further and put an average over this. i.e. I want to average bi weekly
If I’m using time week number and filtering, if I apply MDX for avg story points closed, would that “last periods” only be accounting for the time week numbers showing? or does it look at the hidden periods?