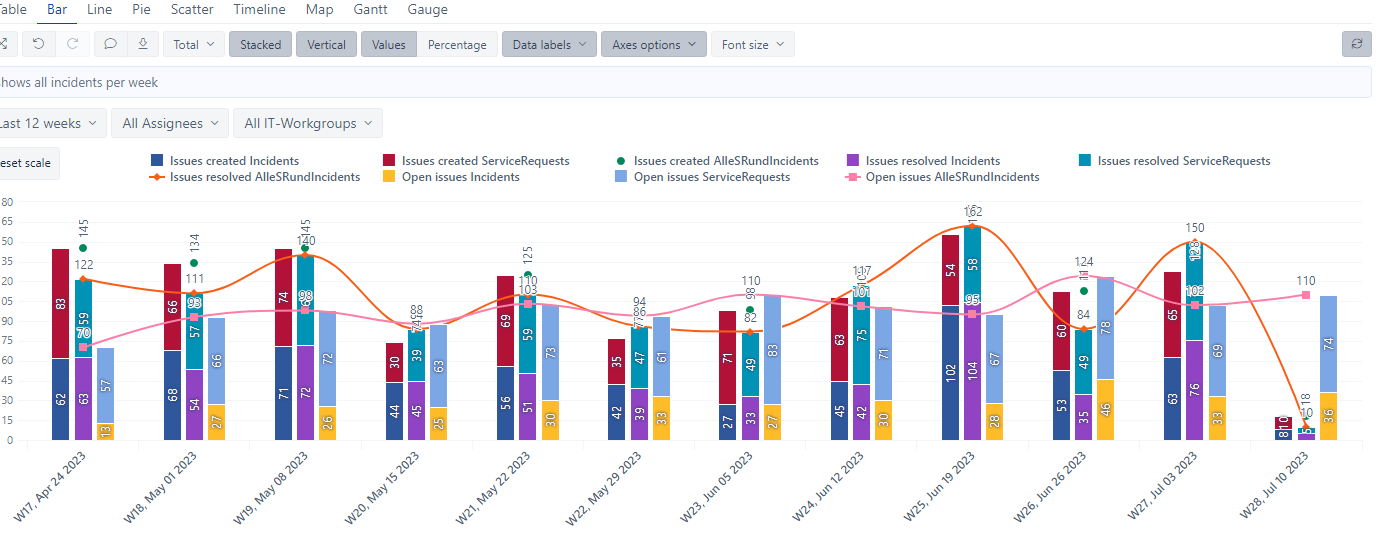
Dear Community,
i have created a report with 2 calculated members and 3 measures for Issue/Service Requests. These are the Created, Open and Resolved Issues. Now it would be fine to see the Total number over each single Bar.
Unfortunately the Text is in the middle for all the 3 bars:
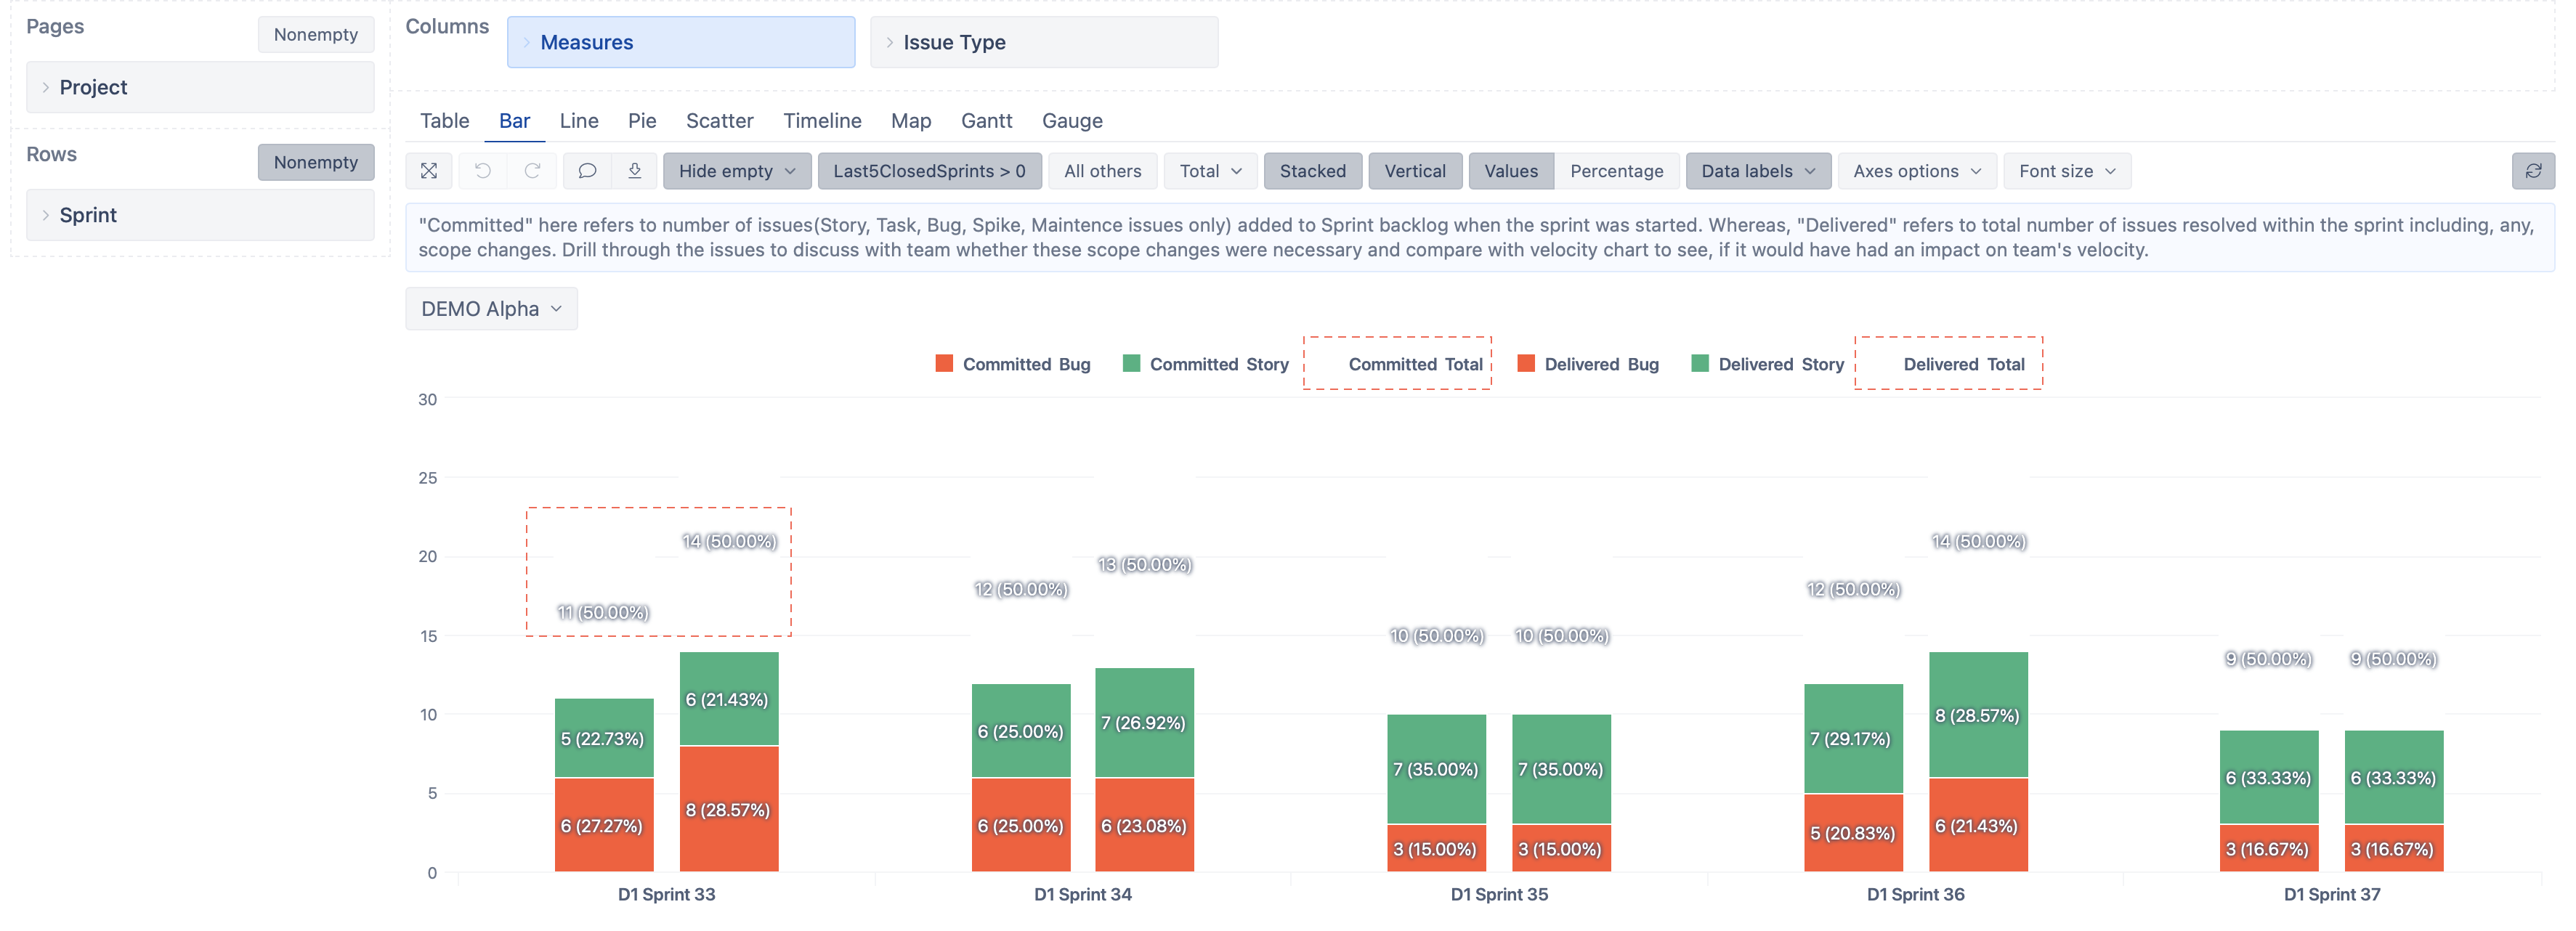
That is the case when combining multiple bars with text/scatter/line charts. The idea is to stack the totals on top of each issue type bar and give them the color white. Then adjust the label position to middle horizontal/vertical. The report could look similar to the one below: