We are using …
JIRA Service Desk 4.6.1
Jira Software 8.6.1
eazyBI Reports and Charts for Jira 6.4.2
I work for an IT department, in the health industry.
I am trying to report on time logged during the ‘On Call’ period of the day.
i.e. outside working hours, 17:00 till 07:00
Members of staff sometimes have to react to problems during the night, for which they log time on a ticket.
However, sometime the issue is not fully resolved, and further worked on during the day.
This time is then also logged on the same ticket.
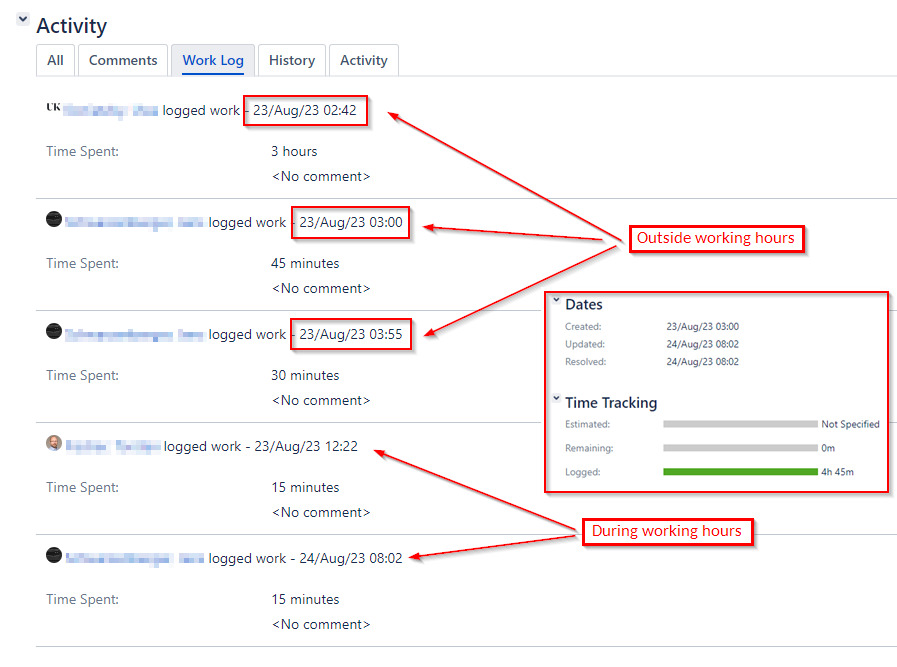
I am trying to separate out the logged time from these tickets, to show how much work is done during ‘out of Hours’ periods.
e.g. in the work log below, 4h 15m was logged ‘out of hours’ & a further 30m was logged during ‘normal working hours’
You can create a new JavaScript custom field for “Worklog start hour” using this code (add it to eazyBI advanced settings):
# Worklog creation hours
[jira.customfield_wl_started_hour]
name = "Worklog started hour"
data_type = "string"
dimension = true
worklog = true
javascript_code = '''
  if (worklog.started) {
  var whour = (worklog.started.match(/T(\d\d):/)[1]).slice(-2)
    worklog.customfield_wl_started_hour = whour;
  }
'''
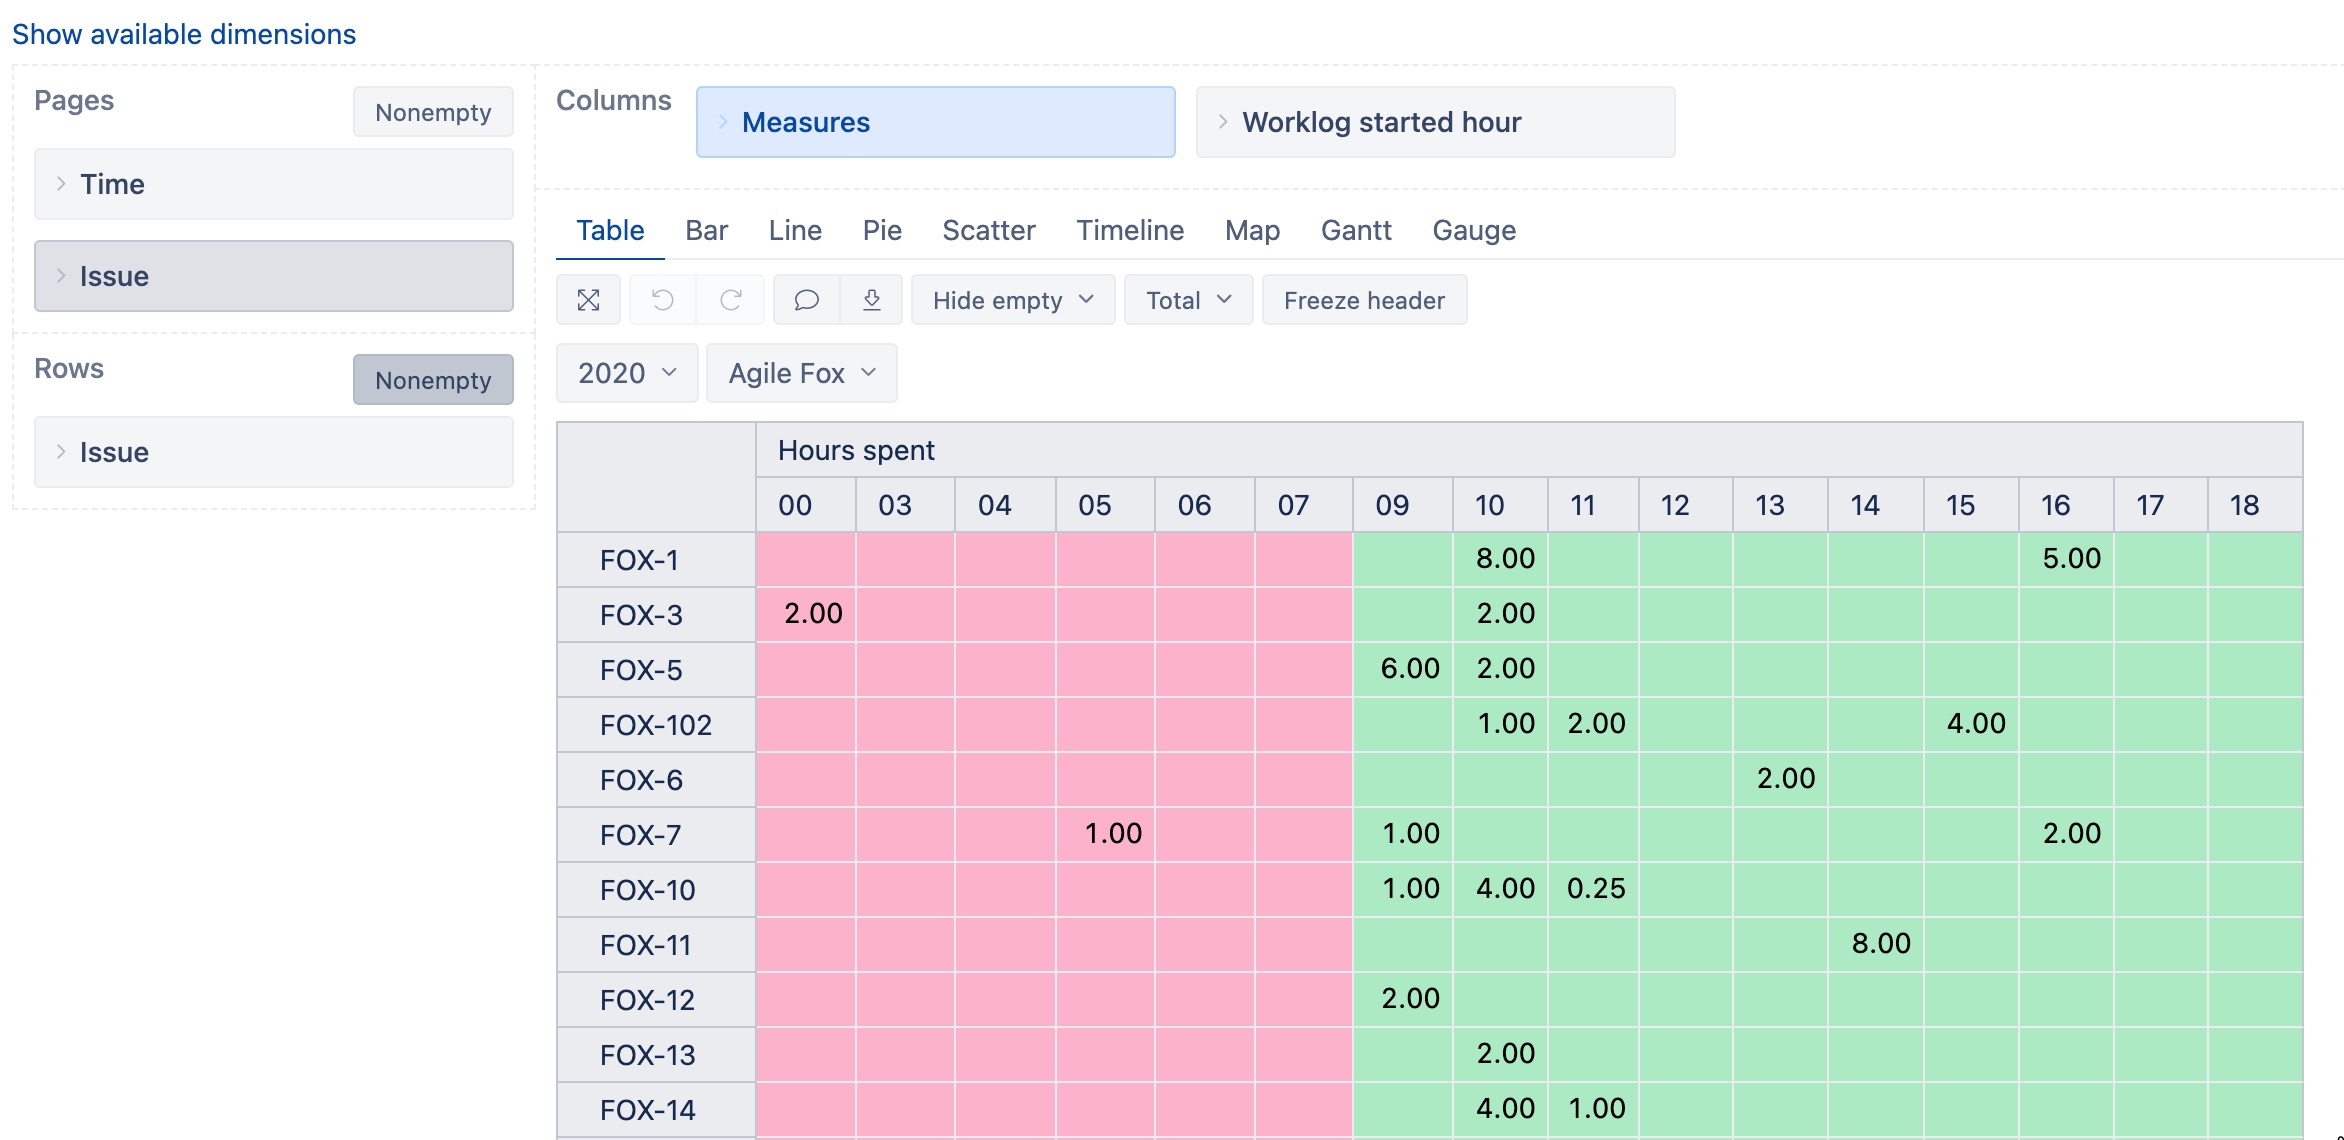
Then, in the import options, select the “Worklog started hour” field for the import. After the import, you should have a new dimension, “Worklog started hour,” that you can use in your report together with the “Hours spent” measure.
The report could look like this (I also applied cell conditional formatting to emphasize the “on call” hours):
Just an apdate to say that your solution worked wonderfully.
I am very happy with the result, thank you.
I have marked your reply as the solution.
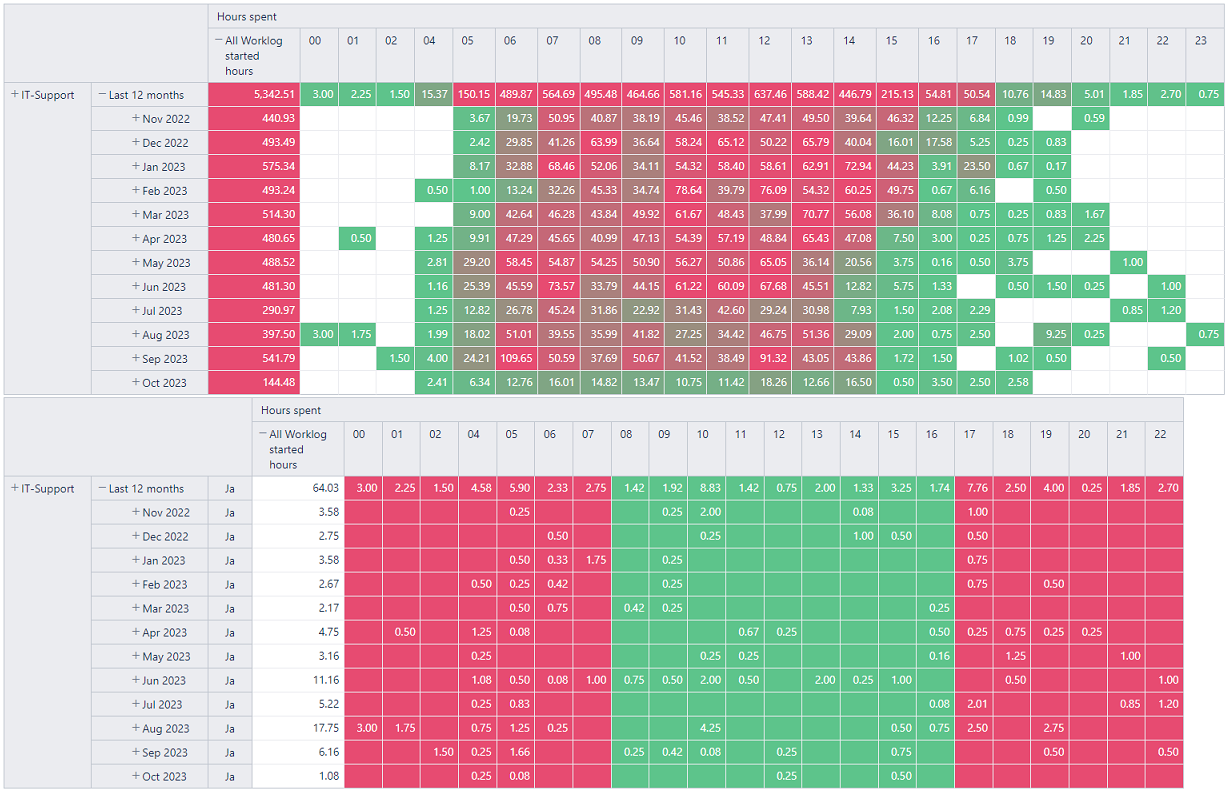
I have made two charts, one which shows the time booked on all or our tickets (last 12 months) with a Heat Map conditional formatting.
I think this nicely shows the average work distribution across the day.
I then drilled through to show only tickets that have the ‘On Call’ flag, and this really shows what I was looking for.
Hours worked per month, outside of normal hours.
Super!
In my charts, the column 03 does not show, presumably because no-one logged time between 03:00 and 04:00 in the last 12 months …
When that eventually happens, the column will appear, and I will be able to apply the conditional formatting to it…
Overall, really happy, thanks again for the help.
Much appreciated.