Hello, EazyBI Community,
I hope this email finds you well. I am an enthusiastic user of EazyBI and I am impressed with the customization capabilities that the platform offers. Recently, I came across the need to create a custom gauge and I would like to know if it is possible in EazyBI.
I would like to have a gauge with a design similar to the one shown in the attached image [insert image of the desired gauge, if possible].
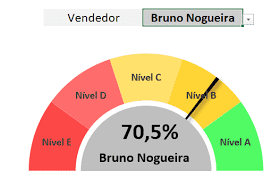
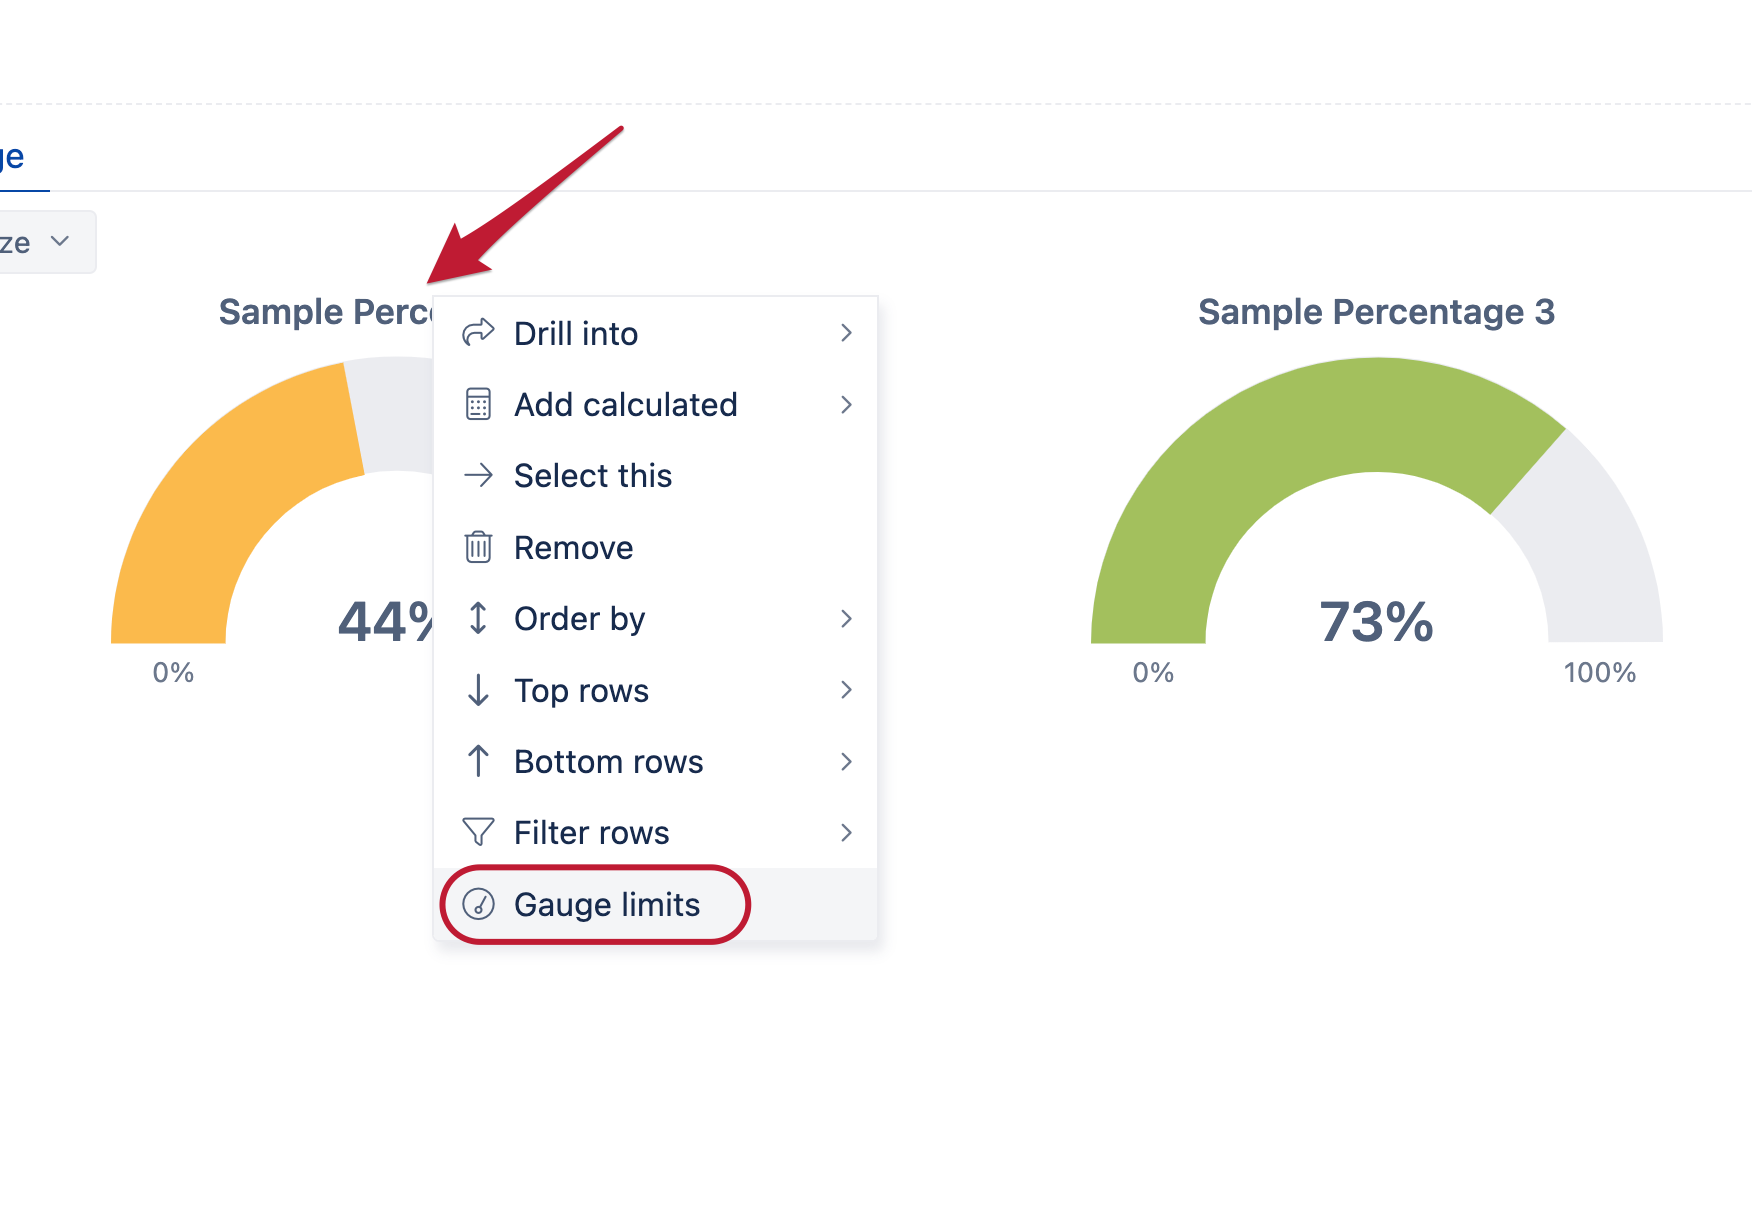
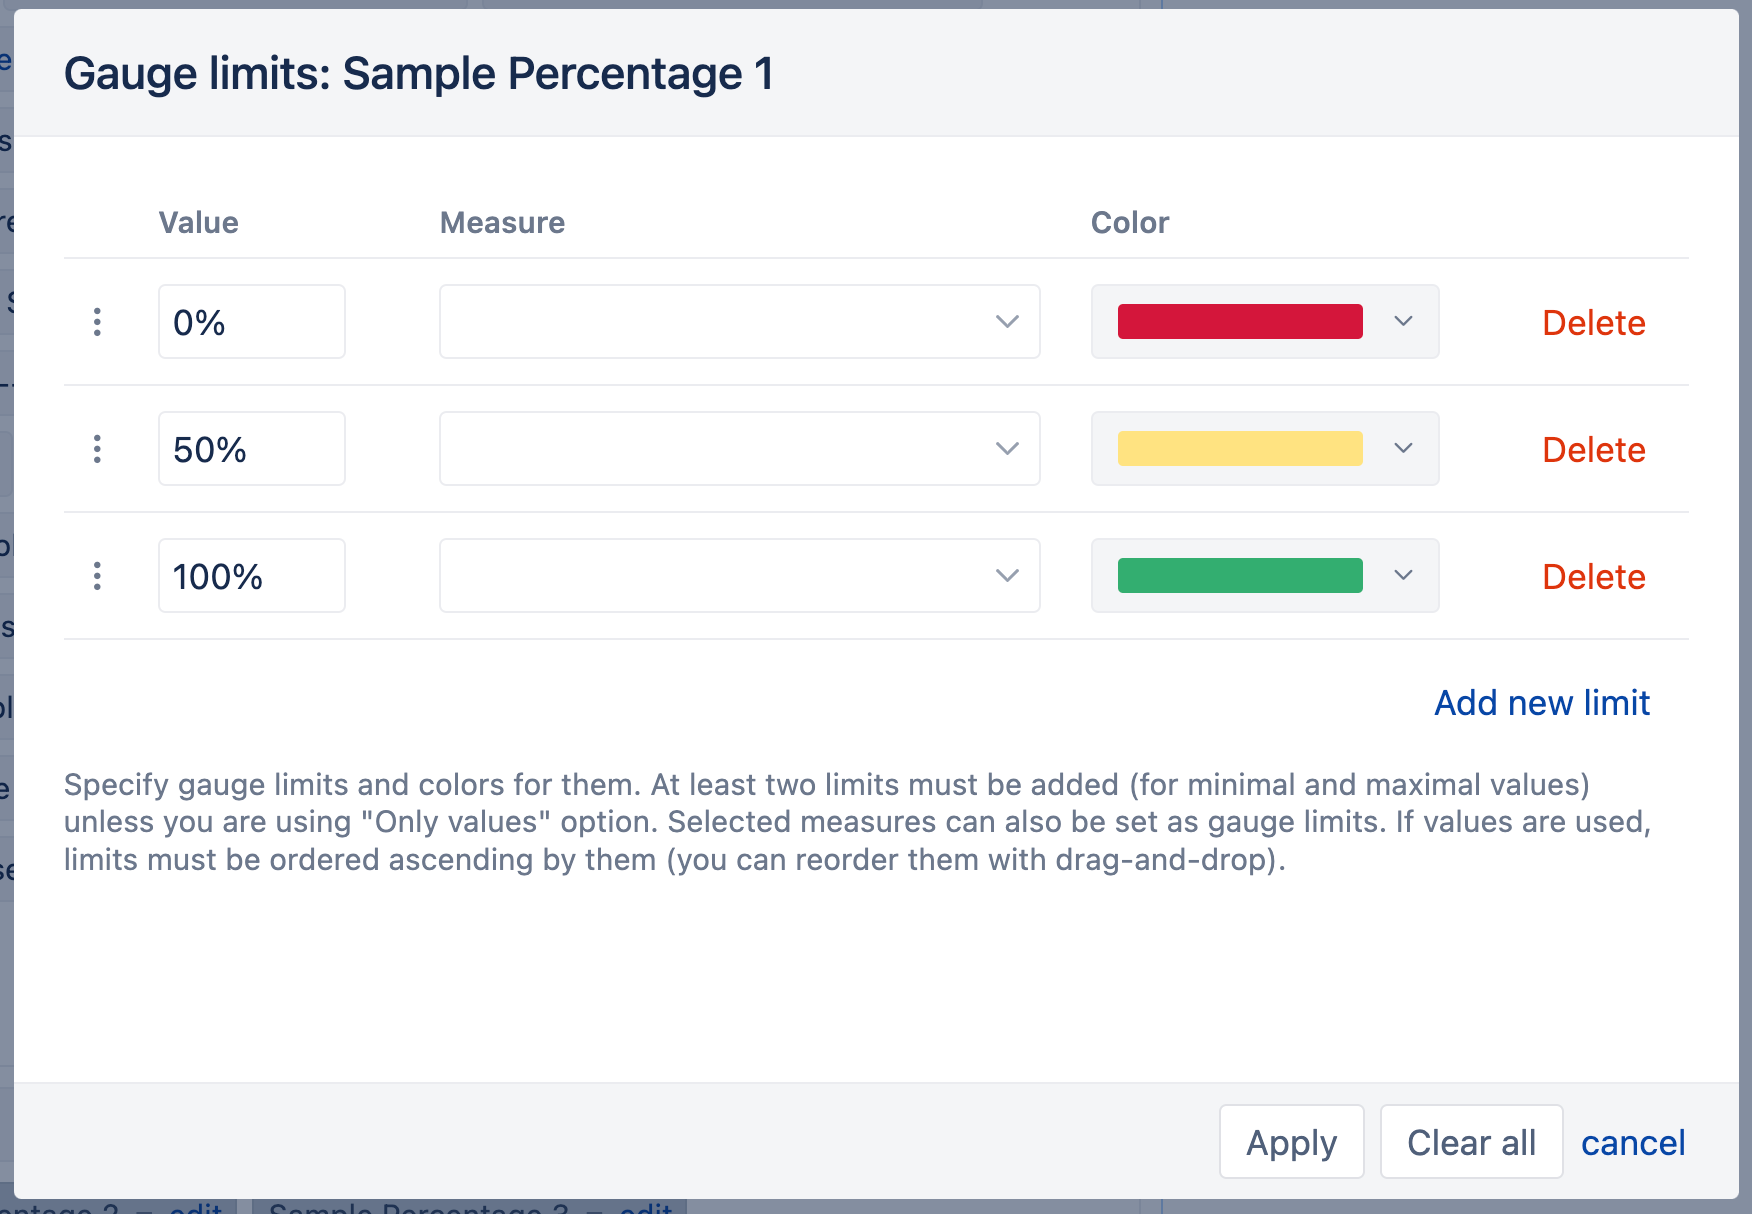
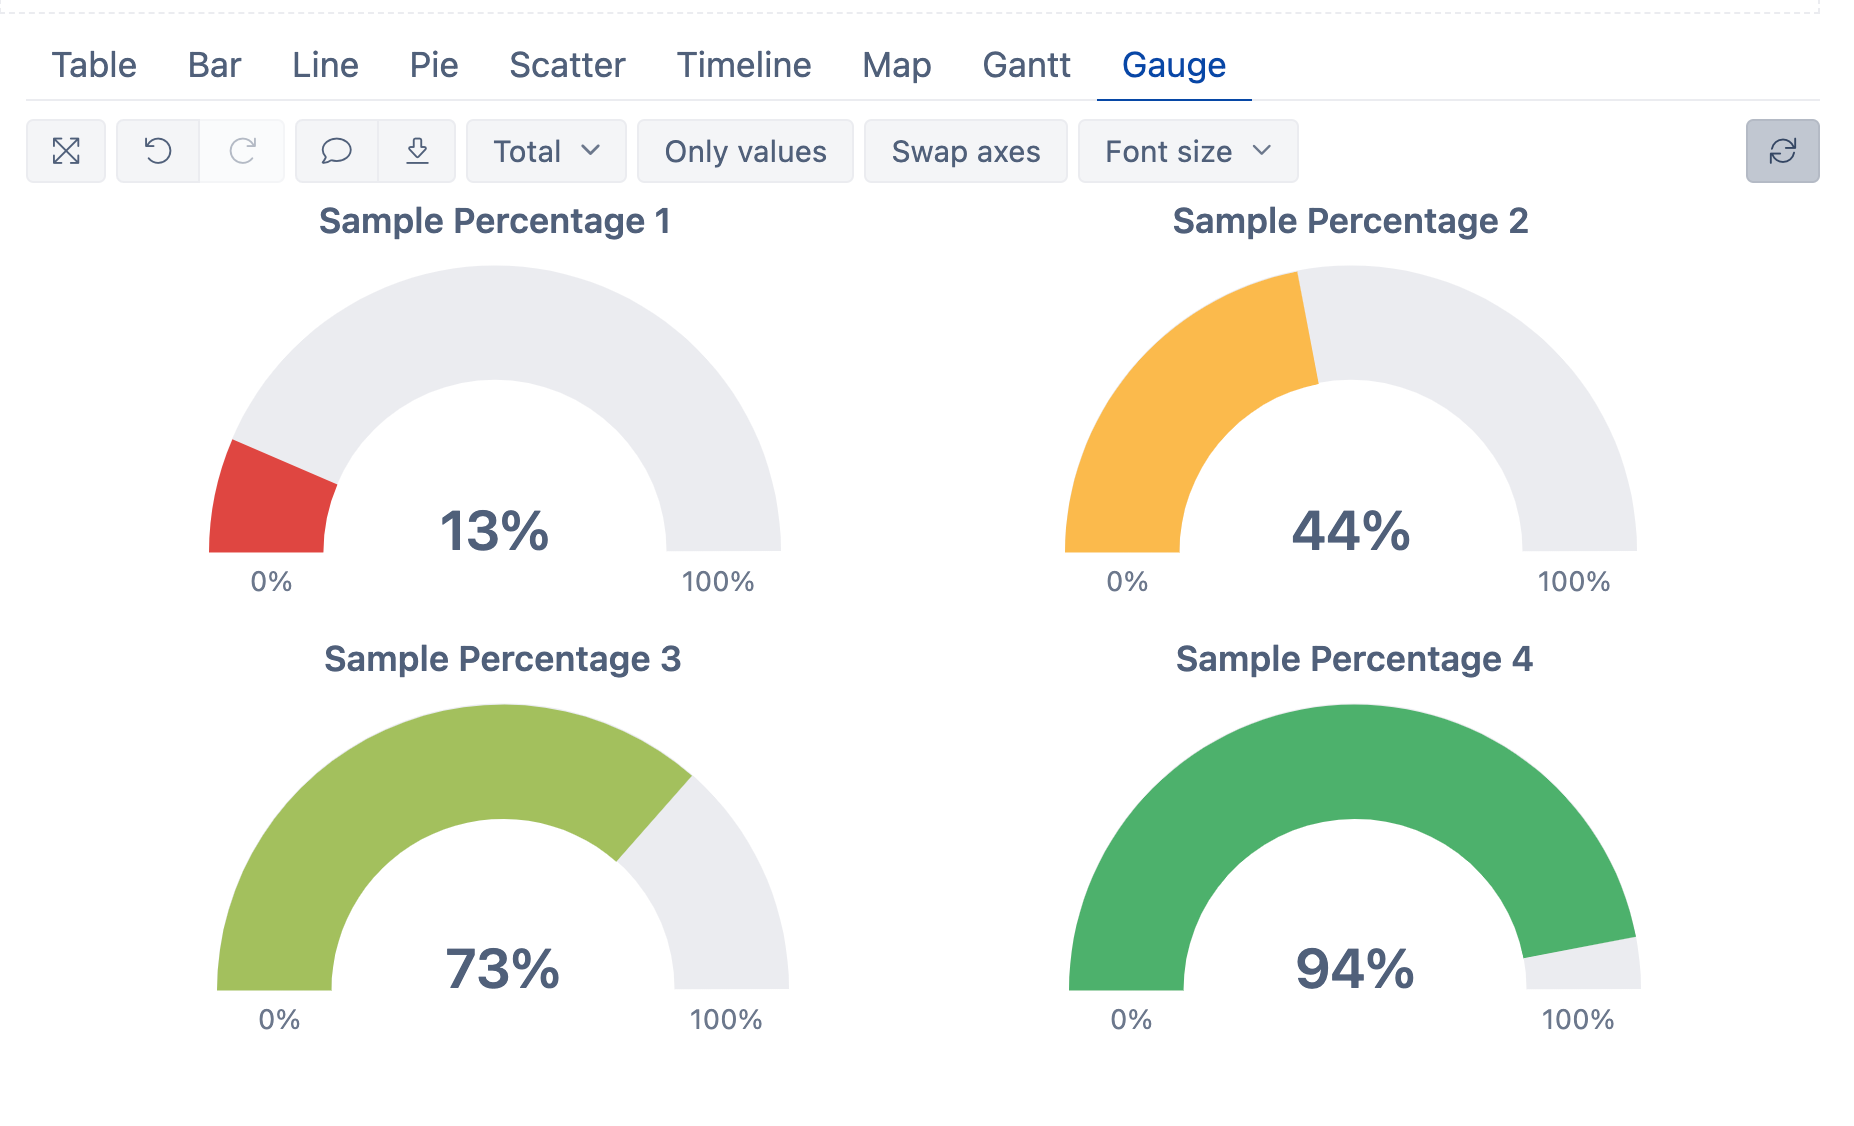
In this gauge, I would like to have three different color zones to represent different levels (e.g., low, medium, and high).
I know that EazyBI offers a variety of chart options, but so far I have not found an option that exactly meets my needs. Therefore, I would like to know if there is any way to create a custom gauge with these features in EazyBI.
Thank you in advance for any guidance, tips, or resources that can help me achieve this goal. I am looking forward to learning and exploring more about the customization possibilities in EazyBI.
Best regards,
Edgar