Hi,
I am trying to make a pie chart that shows the number of issues that took longer then 28days to resolve against those that resolved in under 28days over a 3 month period.
Any help would be much appreciated.
Cheers,
Gav
Hi,
I am trying to make a pie chart that shows the number of issues that took longer then 28days to resolve against those that resolved in under 28days over a 3 month period.
Any help would be much appreciated.
Cheers,
Gav
Any help would be much appreciated?
Hi @gav.yates
You may want to use Resolution interval dimension: Interval dimensions - eazyBI.
You may add it to data import by selecting the option in the import options screen: Jira Issues Import - eazyBI for Jira.
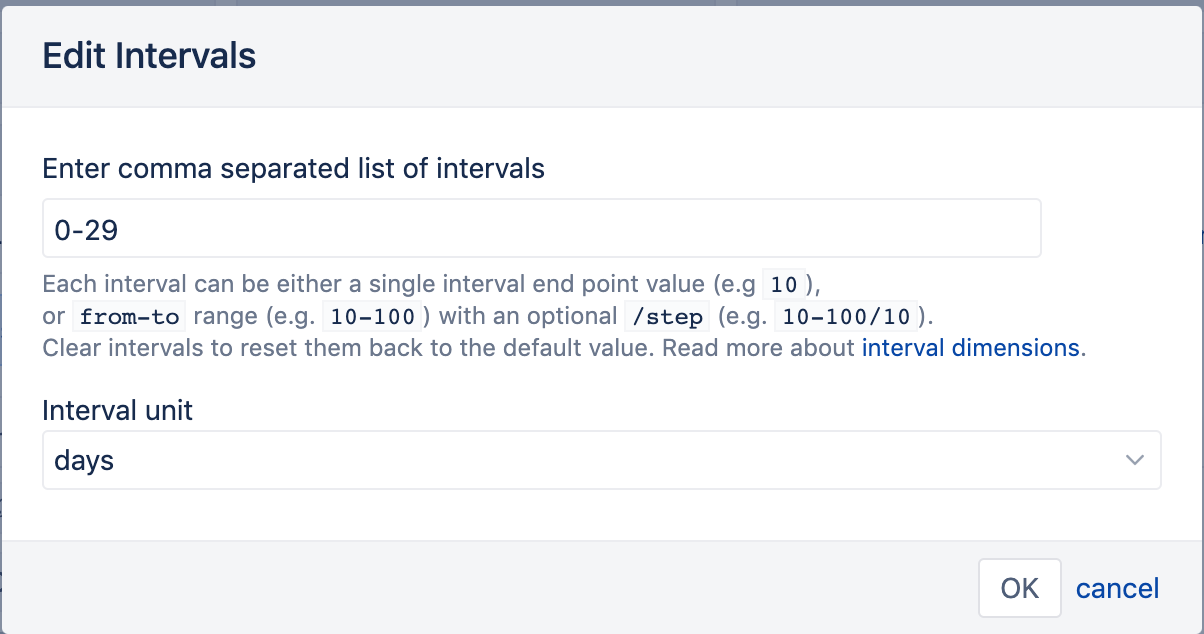
Edit, as described, the intervals in the Resolution interval dimension; if you do not need a more detailed view, you may set only two intervals: up to 28 days and more than 28 days.
The interval definition the would be:
In the report, use this dimension together with measure “Issues resolved” and Time dimension member that represents last 3 months. In such a way, you will get the number of how many issues were resolved in less than 28 and how many in more than 28 days amongst all the issues that have been resolved in the selected time period (and with other filter criteria if you have such).
Example of the report (I have a time period a specific year and additional filter by a project):
Best,
Ilze / support@eazybi.com