REST API response formatting

I’m trying to parse this REST API response:

{
	"expand": "names,schema",
	"startAt": 0,
	"maxResults": 50,
	"total": 1,
	"issues": [
		{
			"expand": "operations,versionedRepresentations,editmeta,changelog,renderedFields",
			"id": "2276831",
			"key": "AAINDEMA-163",
			"fields": {
				"customfield_20823": "{\"ducketId\":\"2\",\"rows\":[{\"rowId\":\"row_db213763-362a-4cad-abc8-d0c4acb8e2c8\",\"columns\":{\"Category\":{\"label\":\"Development\",\"value\":\"Development\",\"optionObject\":{\"label\":\"Development\"}},\"Month\":{\"label\":\"January\",\"value\":\"January\",\"optionObject\":{\"label\":\"January\"}},\"Supplier\":{\"label\":\"PANEL - Development\",\"value\":\"PANEL - Development\",\"optionObject\":{\"label\":\"PANEL - Development\"}},\"Year\":{\"label\":\"2022\",\"value\":\"2022\",\"optionObject\":{\"label\":\"2022\"}},\"Time Units\":100,\"BL Assignable\":{\"label\":\"Yes\",\"value\":\"Yes\",\"optionObject\":{\"label\":\"Yes\"}}},\"order\":0},{\"rowId\":\"row_d962557e-c742-443b-a912-3d047c2a4151\",\"columns\":{\"Category\":{\"label\":\"Certification\",\"value\":\"Certification\",\"optionObject\":{\"label\":\"Certification\"}},\"Month\":{\"label\":\"February\",\"value\":\"February\",\"optionObject\":{\"label\":\"February\"}},\"Supplier\":{\"label\":\"PANEL - Development\",\"value\":\"PANEL - Development\",\"optionObject\":{\"label\":\"PANEL - Development\"}},\"Year\":{\"label\":\"2022\",\"value\":\"2022\",\"optionObject\":{\"label\":\"2022\"}},\"Time Units\":200,\"BL Assignable\":{\"label\":\"Yes\",\"value\":\"Yes\",\"optionObject\":{\"label\":\"Yes\"}}},\"order\":1}]}"
			}
		}
	]
}

I’m using $issues as Data Path, which parse the response like this:

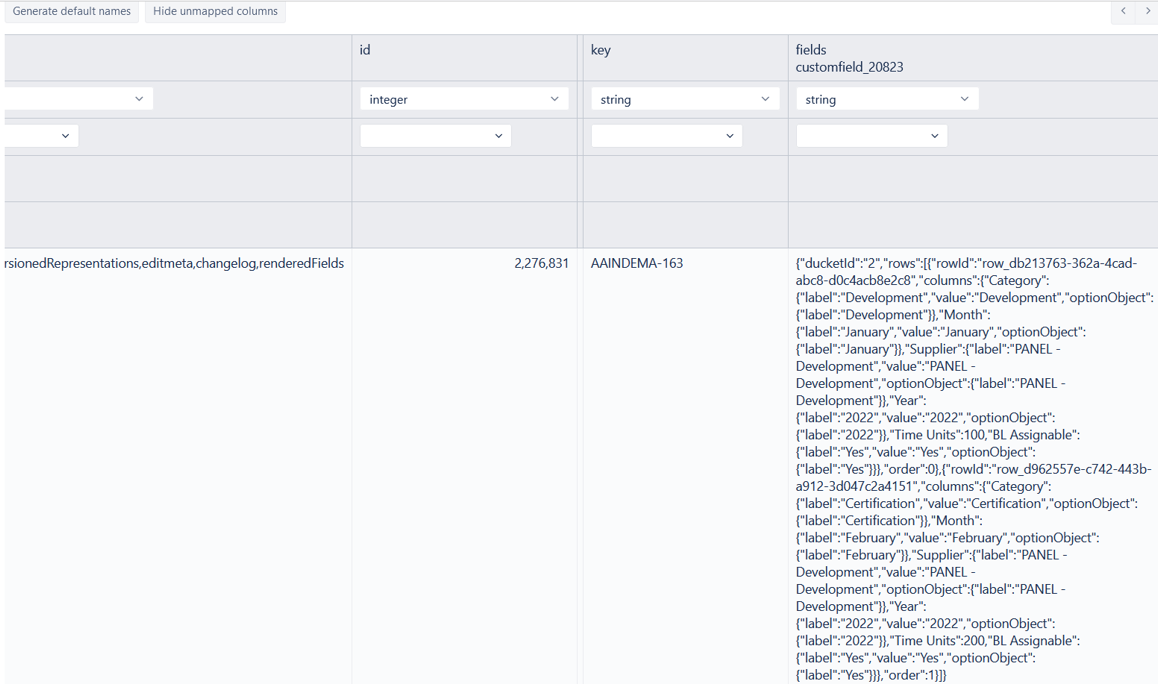
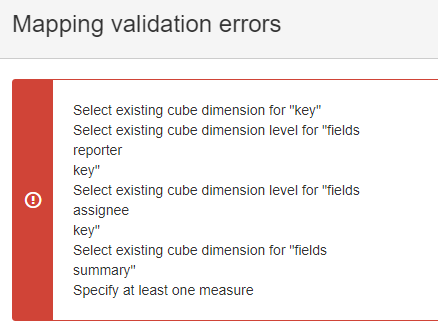
But what I need is something more complex, value from customfield_20823 is also a json formatted as string, I need to get inner “rows” array and parse the objects inside, and for each row on that array create one row for my dataset having common attributes like “key” also on each row, so my expected result would be something like this:

key Category Month Supplier Year Time Units
AAINDEMA-163 Development January PANEL - Development 2022 100
AAINDEMA-163 Development February PANEL - Development 2022 200

Is this possible using Custom JavaScript code or any other way that does not require admin privileges?

Thanks,

Marlen

Hi @Marlen_Arias,

You can shape the retuned result using JavaScript code for the REST API data source: Import from REST API.
Here is another community topic on REST API result modification with JavaScript: eazyBI REST API data contains nest arrays.

An alternative is to use the integrated Jira data source, not REST API. Data import from integrated Jira data source supports issue custom field import (Data from Jira). This might be a more elegant solution.
If some 3rd party app creates the custom field, first, you may check if eazyBi has integration with that app and the field is already available (Data from Jira apps).
If the field is not available by default, you may enable and even process that custom field before import (Advanced settings for custom fields).

Best,
Zane / support@eazyBI.com

Hey guys @Marlen_Arias, @zane.baranovska,

Can u post a standar mapping for REST imports from JQL imput?

I think it can be interresting.

Cheers.

@Javier_Fernandez,

Regarding data import from REST API or other external data sources, there is no standard solution. The data mapping is guided by available data and the intention of how to create the data cube.

In the case of Jira, The standard solution is to use Jira as the data source in eazyBI: Data from Jira. It is already developed integration.

Best,
Zane / support@eazyBI.com

Well, JSON object from JQL output via REST is standard, I believe there can be a minimal definition of an issue like “key,summary,reporter,assignee”.

How will be the standar mapping for columns key, summary, reporter and assignee?

thanks.

Suppose you have data source with those four fields key,summary,reporter,assignee, then I would suggest data mapping like this:

  • key: map as new dimension “Issues”. See documentation on data mapping, Rule 2
  • summary: map as property for the “Issue”. See documentation on data mapping, Rule 3
  • reporter: map as new dimension “Reporter”
  • assignee: map as new dimension “Assignee”
  • As data source has no numeric values that could be imported as measures, choose option Append row count measure that would count each imported line. In this use case, it would show imported issue count. See documentation on data mapping, Rule 1

key : map as new dimension “Issues”.
image

summary : map as property for the “Issue”.
image

reporter: map as new dimension “Reporter”
image

assignee: map as new dimension “Assignee”
image

  • choose option Append row count measure
    where? (its Jira onPremise)

Result:

image

@Javier_Fernandez, you have quite an old eazyBI version. This option is available on Cloud and since eazyBI version 6.5. Please see the documentation on data mapping: Data mapping.

Suppose you plan on sticking with an older eazyBI version. In that case, you should look for another data source that would provide more data, including numerical value, which could be used as a Measure to count the imported issues.