Hello Degan,
To me it seems you are overcomplicating this. Keep it simple, use whatever already available without too much customization (it works faster and it will be easier to debug as well).
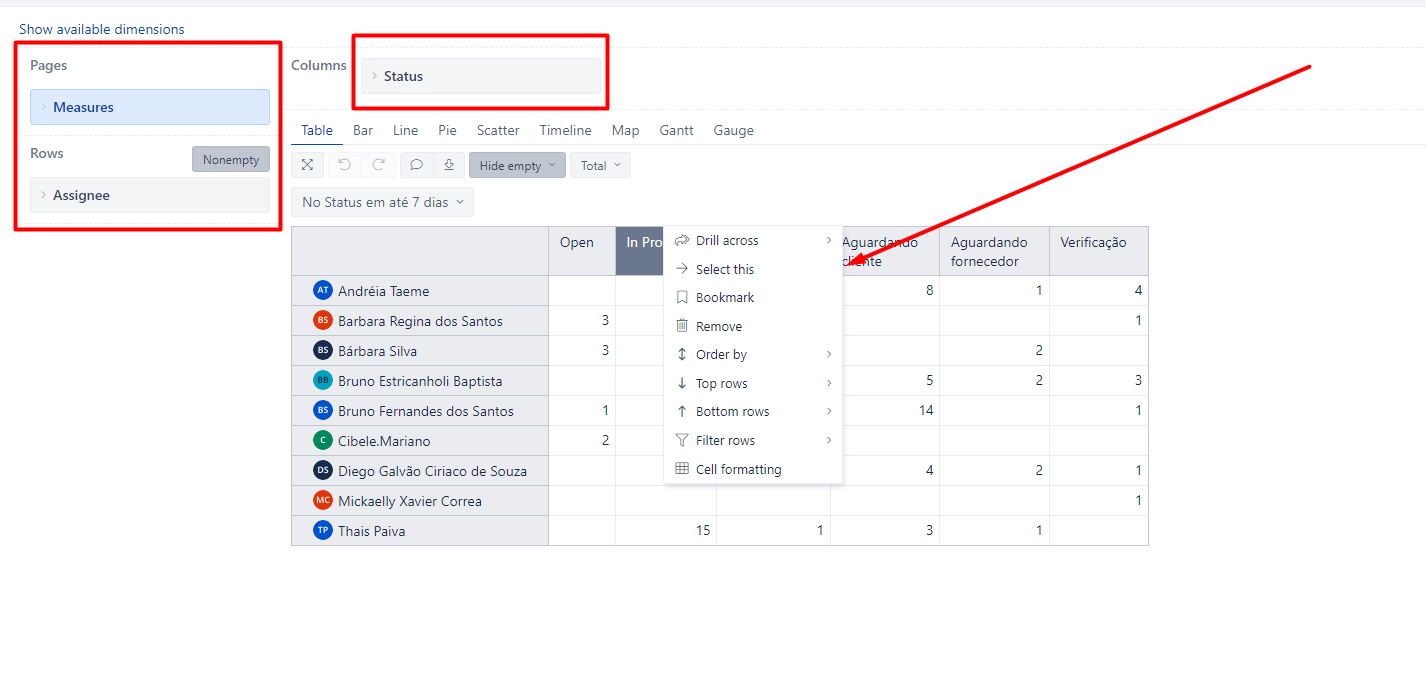
(as a personal remark: I have never seen “measures” on “pages”)
From the screenshot you posted I assumed you were trying to get the number of issues for each user, split by issue’s status. Please correct me if I am wrong. 
The solution to the problem (as I understand it - once more, sorry if get it wrong!) will be as follows:
{
"cube_name": "Issues",
"cube_reports": [ {
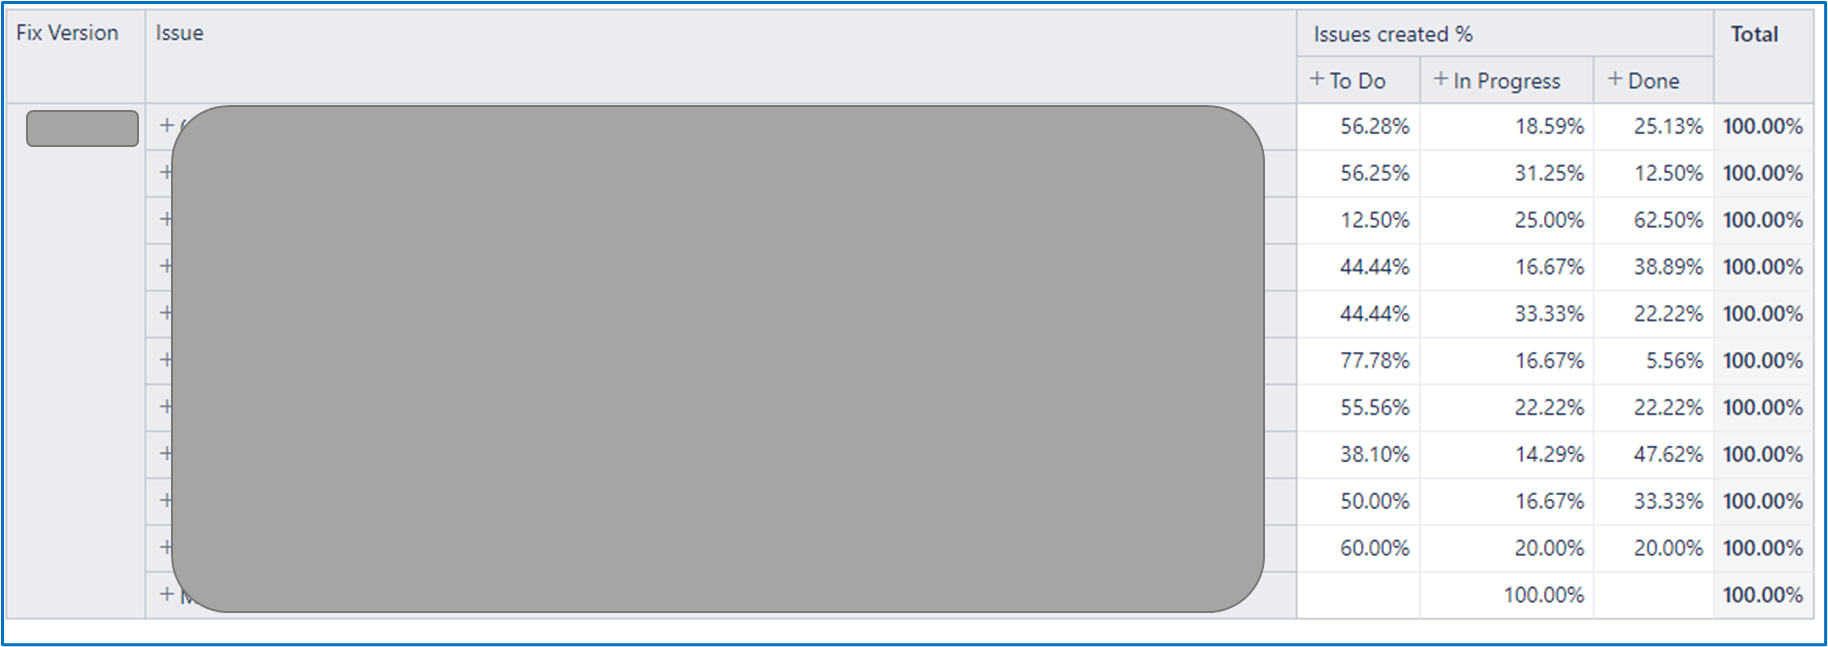
"name": "issue percentages",
"folder_name": "VasileS.playground",
"result_view": "table",
"definition": {"columns":{"dimensions":[{"name":"Measures","selected_set":["[Measures].[Issues created]","[Measures].[Issues created %]"],"members":[]},{"name":"Status","selected_set":["[Status.Category].[Category].Members"],"members":[],"bookmarked_members":[]}]},"rows":{"dimensions":[{"name":"Assignee","selected_set":["[Assignee].[All Assignees]"],"members":[],"bookmarked_members":[]}],"nonempty_crossjoin":true},"pages":{"dimensions":[]},"options":{},"view":{"current":"table","maximized":false,"table":{"row_dimension_headers":{"Assignee":true},"cell_formatting":{}}},"calculated_members":[]}
} ],
"calculated_members": [{"name":"Issues created %","dimension":"Measures","formula":"[Measures].[Issues created]\n/ \n(\n [Measures].[Issues created], \n [Status.Category].DefaultMember\n)\n","format_string":"#0.00%"}]
}
There is no calculated field, member, filter and there is the possibility to drill, collapse, add more filters on “Pages” section, …
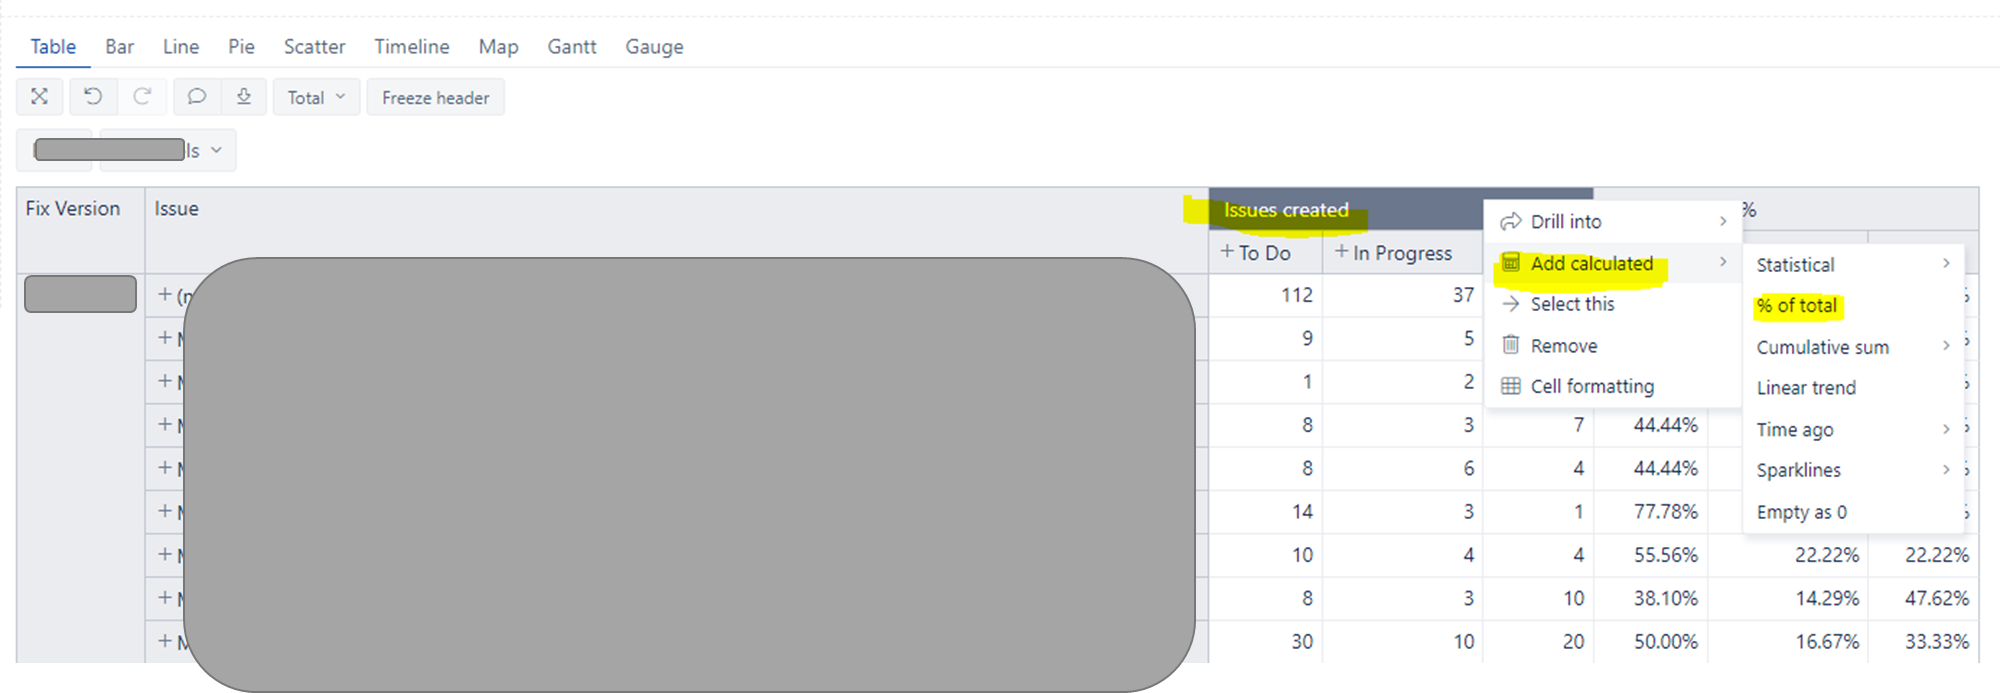
Clicking “Issues created” (the column header) will have the option to “add calculated” in the context menu that is opened.
Kind regards,
VasileS.