Hello,
I’m trying to create a chart presenting a set of issues (epics) by their target end date and simultaneously its cumulative score.
Something similar to this:
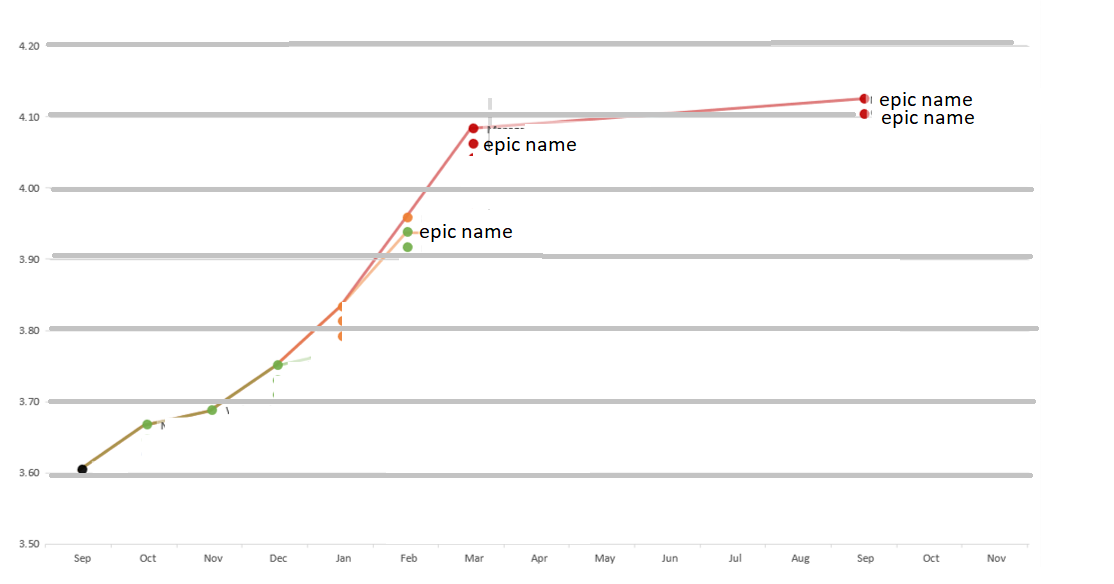
But this time I have no idea where to start. Any suggestions?
Thanks,
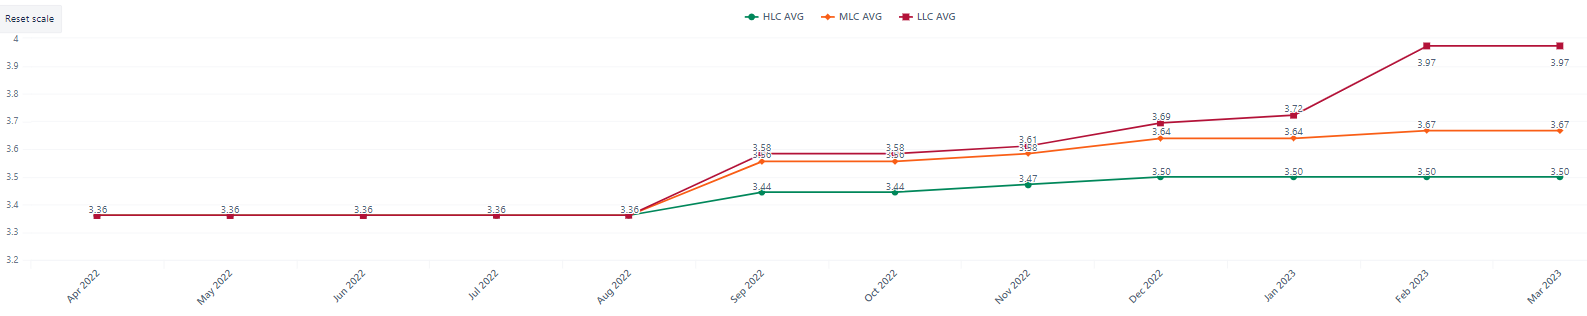
I’ve been able to pull out a line chart to present the cumulative score based on monthly progress (issue target end dates) and issue RAG Status. But something is incorrect, as the 3 lines (rag status) doesn’t start at the same point.
I believe the issue is in the “Date” filter selected, but I’m unable to figure out how to fix it.
This is the formula used to compute the high-level confidence line (that works as expected):
-- annotations.group = progress chart
aggregate(
Generate(
    ChildrenSet([Issue].CurrentHierarchyMember),
    Descendants([Issue].CurrentHierarchyMember, [Issue].[Issue])),
    CASE --[Measures].[Issue status] = 'Done'
      DateBeforePeriodEnd([Measures].[Issue Target end], [Time].CurrentHierarchyMember)
      WHEN [Measures].[Issue RAG Status] = "Red" THEN 3
      WHEN [Measures].[Issue RAG Status] = "Amber" THEN 3
      WHEN [Measures].[Issue RAG Status] = "Green" THEN 4
      END
)
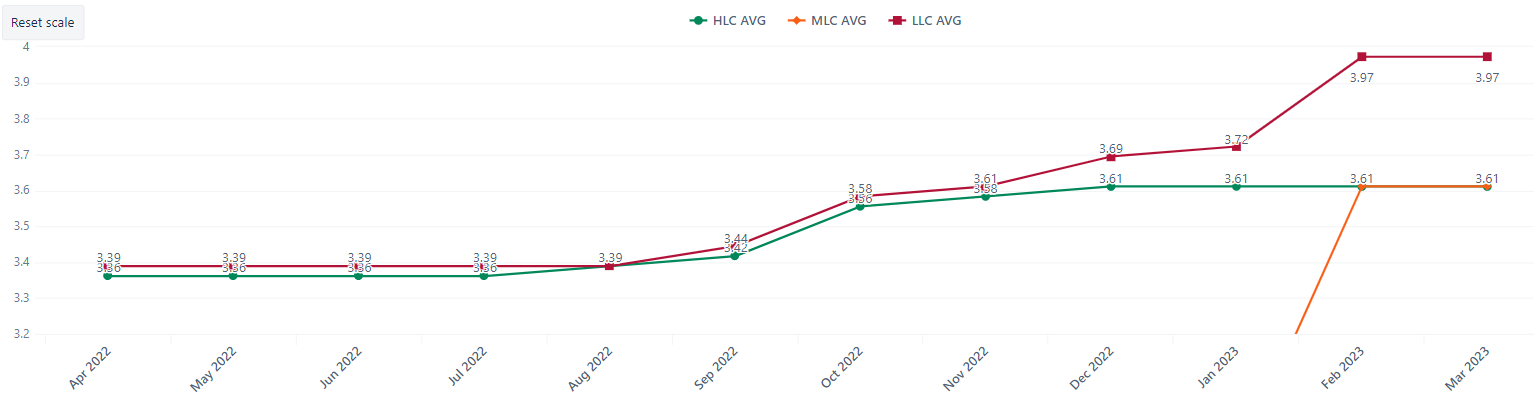
But when try to adjust it for the medium-level is simply fails
aggregate(
Generate(
    ChildrenSet([Issue].CurrentHierarchyMember),
    Descendants([Issue].CurrentHierarchyMember, [Issue].[Issue])),
    CASE
      DateBeforePeriodEnd([Measures].[Issue Target end],[Time].CurrentHierarchyMember)
      WHEN [Measures].[Issue RAG Status] = "Red" THEN 3
      WHEN ([Measures].[Issue RAG Status] = "Green") or ([Measures].[Issue RAG Status] = "Amber") THEN 4
      END
)
Immediately assuming all RED rag status with a value of 4 regardless of the defined target end date
by default, all features have a value of 3. Such value should only change after the target end date is accomplished
Any idea where is the problem ?
Hi
Try this formula with a numerical measure for the report context.
Sum(
Filter(
DescendantsSet([Issue].CurrentMember, [Issue].[Issue]),
[Measures].[Issue type] = "Epic"
AND
DateBeforePeriodEnd([Measures].[Issue Target end],[Time].CurrentHierarchyMember)
),
CASE WHEN
Cache(
Sum({PreviousPeriods([Time].CurrentHierarchyMember),
[Time].CurrentHierarchyMember},
[Measures].[Issues with Target end]
)
)>0
THEN
CASE
WHEN [Measures].[Issue RAG Status] = "Red" THEN 3
WHEN ([Measures].[Issue RAG Status] = "Green") or ([Measures].[Issue RAG Status] = "Amber") THEN 4
END
END
)
Martins / eazyBi
Hi Martin,
It doesn’t fit the purpose of the formula, cause it ignores the period until the target end date is achieved.
I’ve adjusted the initial formula to:
-- annotations.group = CSB
aggregate(
Generate(
   ChildrenSet([Issue].CurrentHierarchyMember),
    Descendants([Issue].CurrentHierarchyMember, [Issue].[Issue])),
    IIF(DateBeforePeriodEnd([Measures].[Issue Target end], [Time].CurrentHierarchyMember),
      IIf([Measures].[Issue RAG Status] = "Red",3,4),
      [Measures].[Control Score])

))
Please export and share the definition of your report.
https://docs.eazybi.com/eazybi/analyze-and-visualize/create-reports/export-and-import-report-definitions
Martins / eazyBI