Scatter - Due Date on x Axis

Hi eayzBI Team,

I want to do a scatter report with bubbles.

my fields are:
“expected value” on y axis
“due date” on x axis
“potential value” as bubble size

Is it possible to have the due date on the x axis?
In this demo you did it with the resolution date: https://eazybi.com/accounts/1000/cubes/Issues/reports/50047-issue-resolution-days-over-time

what i did so far:

I put the time dimension in in the rows section and measures in the column section.
As measure I selected “expected value”, “potential value” and now I need the due date as user defined measure.
I did a user defined measure with: [Time].CurrentHierarchyMember.StartDate but i dont want the startdate of the issue i want the due date.
What do i have to do?

Thanks for your support

Regards
Ersin

Hi @Ersin!

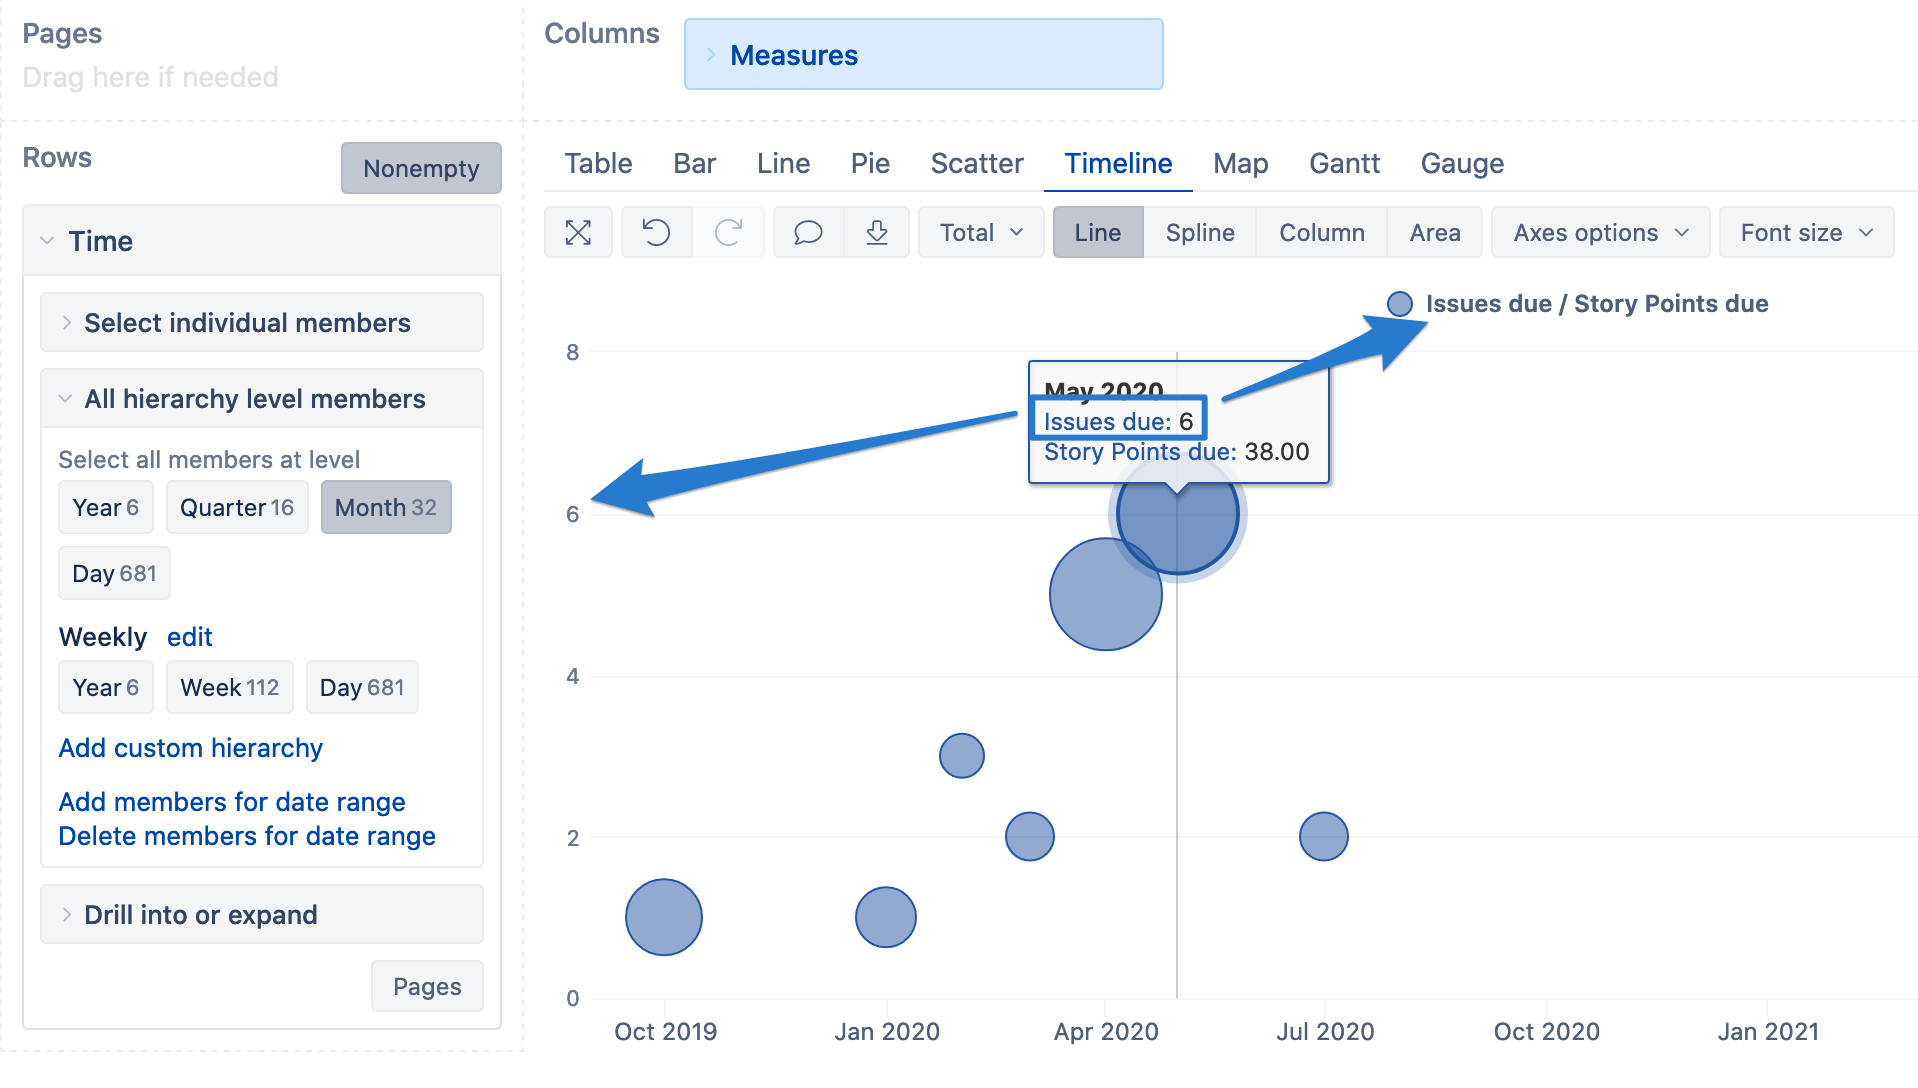
To see the numeric values grouped by the due date, you can use the Measures ending with due. So, for example, Expected value due would give you the total expected value of issues due in the period.

And possibly, if you do not wish to further drill into the bubble (as with priority in the example report), you could use the Bubble type in the Timeline chart, as in this example: https://eazybi.com/accounts/1000/cubes/Issues/reports/355554-issue-resolution-days-over-time-with-trend.
The report would look similar to this:

Note that I am using two due measures, you would use Expected value due and Potential value due and, in the timeline chart, click on the color box of the first one to select type bubble.

Lauma / support@eazybi.com