Is there a way to add Line graph to a scatter plot? I am working a Cycle time graph and currently have it has a scatter plot but I want to add a average line as well.
To get a scatter or a bubble chart along with a line, you may build the graph in Bar tab.
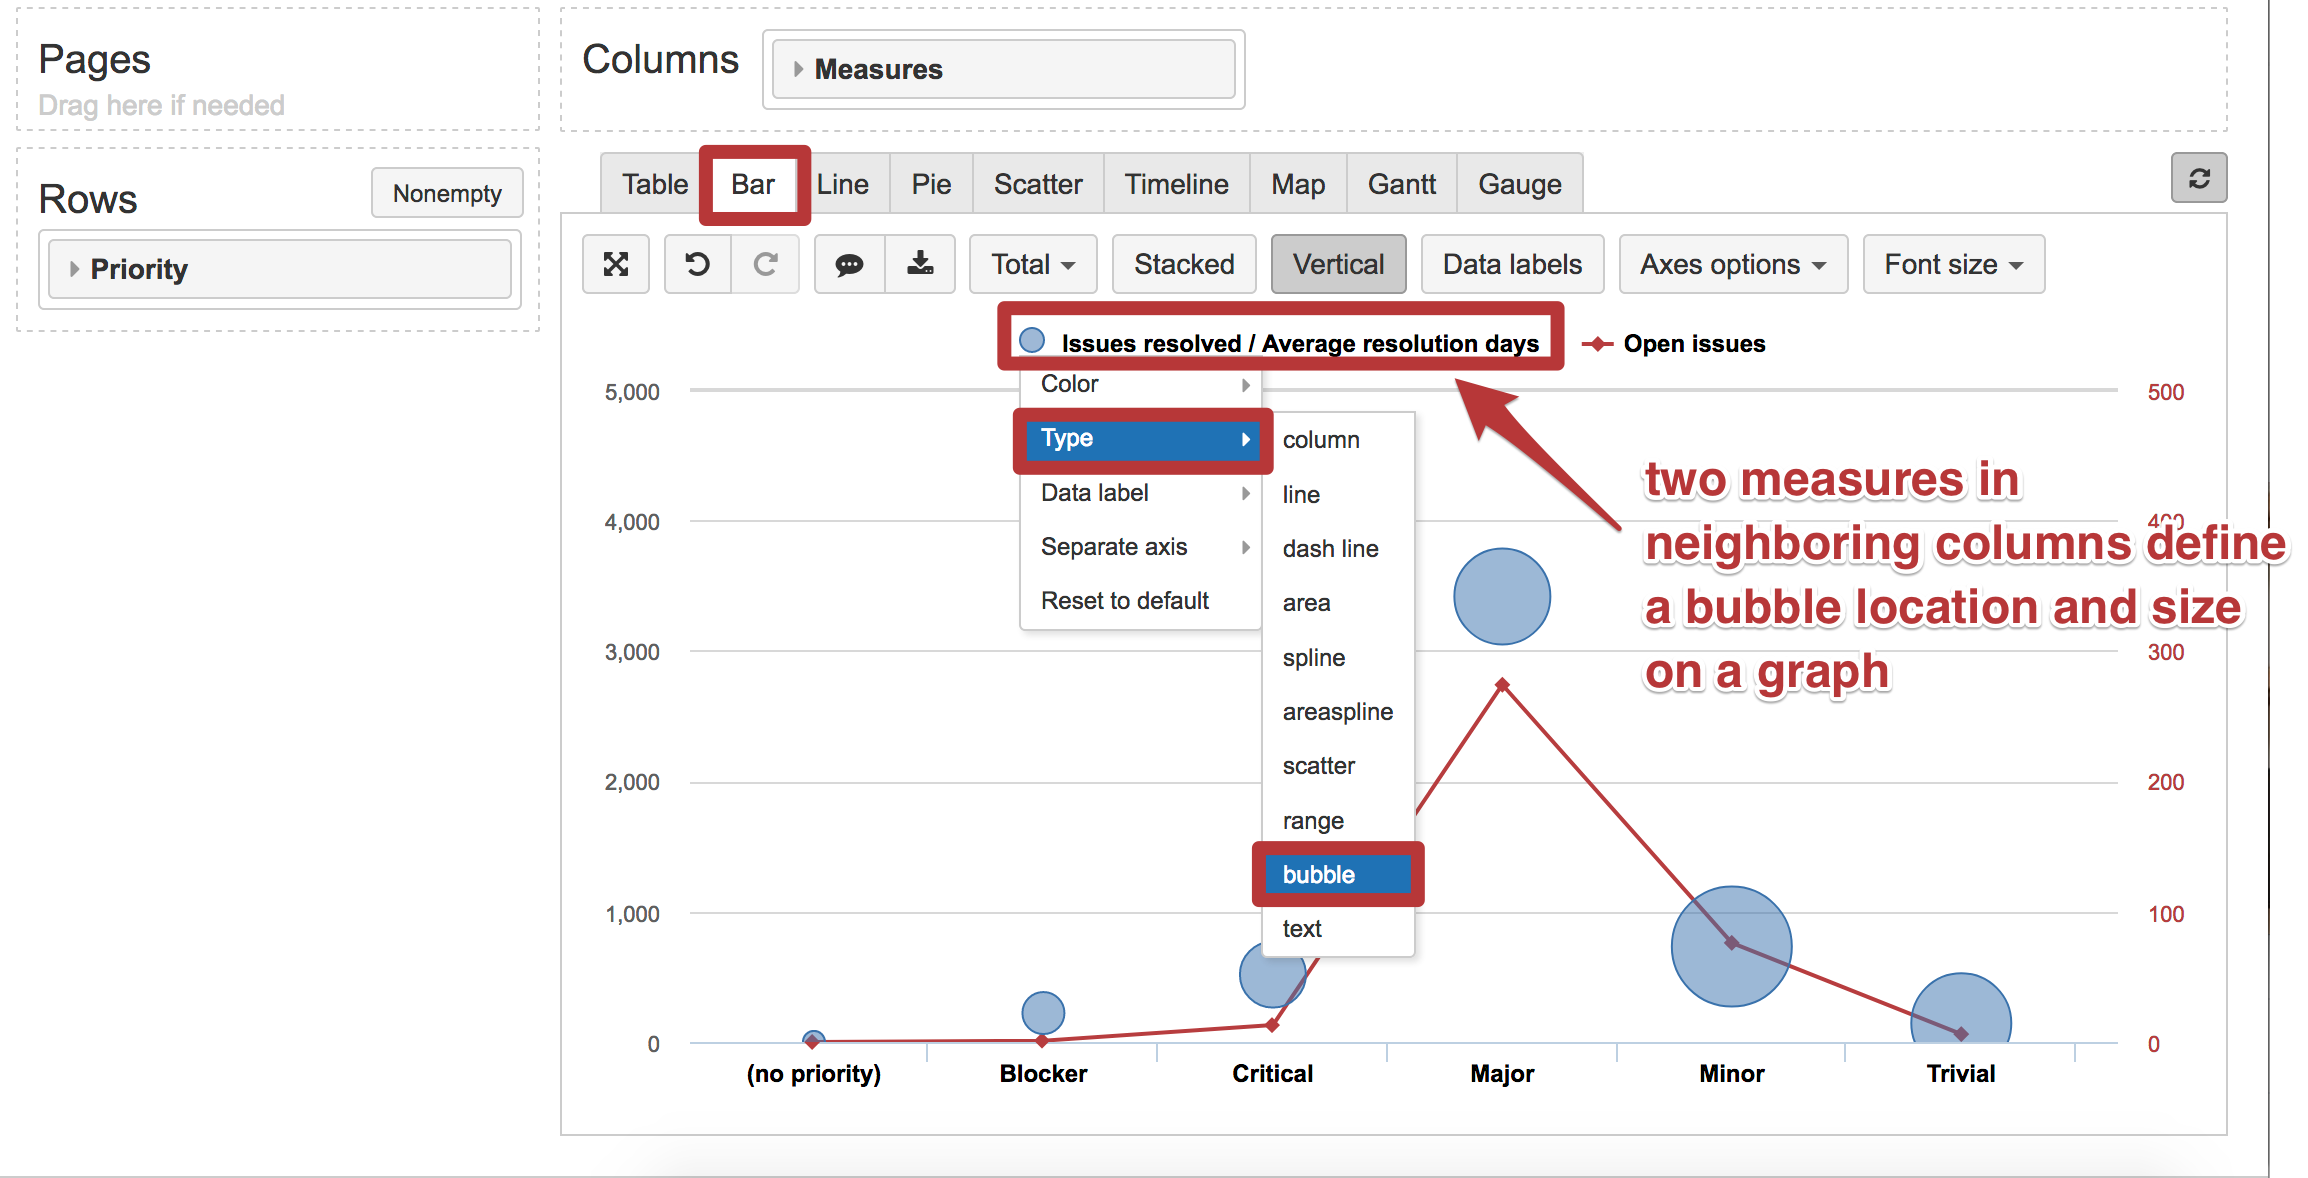
The Bar chart has a lot of graph types for measure representation, including scatter, bubble and line (see picture below).
Best,
Zane / support@eazyBI.com
Thanks! This was what i needed.