Hello Viviane,
thank you very much for your reply.
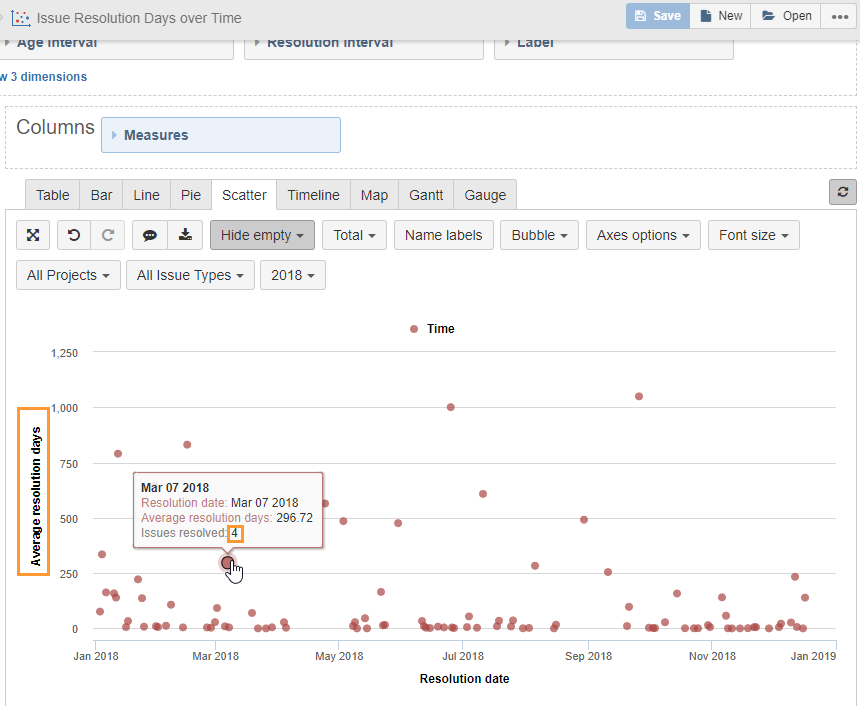
I tried your suggestion, and I got is this far:
So it looks already pretty good.
The only thing, that there is a new color/symbol for every day … is that also in your graph?
(marked orange in the screenshot)
Thank you again, and best regards,
Markus
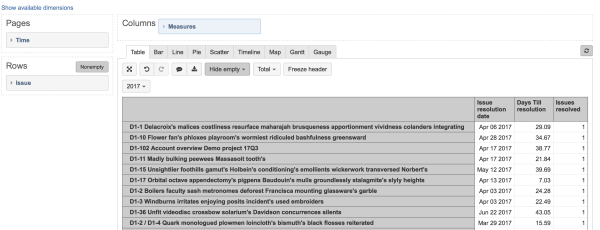
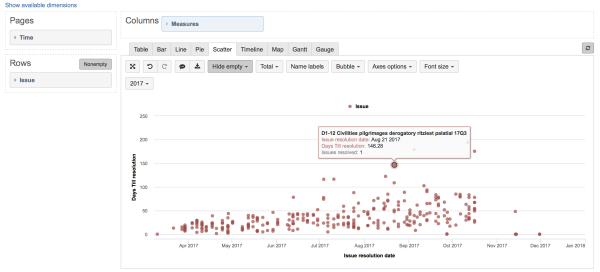
edit: Here is also the source for the report I created (not sure if everything is as it should be)
{
“cube_name”: “Issues”,
“cube_reports”: [ {
“name”: “Issue Resolution Days over Time - Single Issues”,
“folder_name”: “Issue Analysis Reports”,
“result_view”: “scatter_chart”,
“definition”: {“columns”:{“dimensions”:[{“name”:“Measures”,“selected_set”:["[Measures].[Resolution date]","[Measures].[Resolution time]"],“members”:null}]},“rows”:{“dimensions”:[{“name”:“Time”,“selected_set”:["[Time.Weekly].[2018]"],“selected_set_expression”:“DescendantsSet({{selected_set}}, [Time.Weekly].[Day])”,“members”:null,“bookmarked_members”:null},{“name”:“Issue”,“selected_set”:["[Issue].[Stories and Defects]"],“members”:[{“depth”:0,“name”:“Stories and Defects”,“full_name”:"[Issue].[Stories and Defects]",“drillable”:true,“type”:“all”,“expanded”:true,“drilled_into”:false},{“depth”:1,“name”:“ATC Internal”,“full_name”:"[Issue].[ATC Internal]",“drillable”:true,“key”:“ATCI”,“expanded”:true,“drilled_into”:false,“parent_full_name”:"[Issue].[Stories and Defects]"}],“bookmarked_members”:null}],“nonempty_crossjoin”:true},“pages”:{“dimensions”:[{“name”:“Project”,“selected_set”:["[Project].[All Projects]"],“members”:[{“depth”:0,“name”:“All Projects”,“full_name”:"[Project].[All Projects]",“drillable”:true,“type”:“all”}],“bookmarked_members”:null,“current_page_members”:["[Project].[All Projects]"]},{“name”:“Time”,“duplicate”:true,“selected_set”:["[Time.Weekly].[All Times]"],“members”:[{“depth”:0,“name”:“All Times”,“full_name”:"[Time.Weekly].[All Times]",“drillable”:true,“type”:“all”,“expanded”:true,“drilled_into”:false},{“depth”:1,“name”:“2018”,“full_name”:"[Time.Weekly].[2018]",“drillable”:true,“expanded”:true,“drilled_into”:false,“parent_full_name”:"[Time.Weekly].[All Times]"}],“bookmarked_members”:null,“current_page_members”:["[Time.Weekly].[2018]"]}]},“options”:{“nonempty”:true},“view”:{“current”:“scatter_chart”,“maximized”:false,“scatter_chart”:{“show_labels”:false,“series_options”:{“Critical”:{“color”:"#4572A7"},“Major”:{“color”:"#3D96AE"},“Minor”:{“color”:"#81CEE4"},“Trivial”:{“color”:"#B5CA92"},"(no priority)":{“color”:"#E8E8E8"},“Blocker”:{“color”:"#000000"}},“y_axis_measure”:"[Measures].[Average resolution days]"},“table”:{}}}
} ],
“calculated_members”: [{“dimension”:“Measures”,“name”:“Average resolution days”,“format_string”:"#,##0.00",“formula”:“CASE WHEN [Measures].[Issues resolved] > 0 THEN\n [Measures].[Total resolution days] / [Measures].[Issues resolved]\nEND”,“annotations”:{“group”:“Default”}},{“name”:“Resolution Date”,“dimension”:“Measures”,“formula”:"[Time].CurrentHierarchyMember.StartDate",“format_string”:“mmm dd yyyy”},{“name”:“Resolution time”,“dimension”:“Measures”,“formula”:" DateDiffWorkdays([Issue].get(‘Created at’),\n [Issue].get(‘Resolved at’))",“format_string”:""}]
}