Hi All! New to the community here as I’ve learned a ton and gotten this super close to the finish line by reviewing other posts, but I’m up against a challenge beyond my level of understanding to solve.
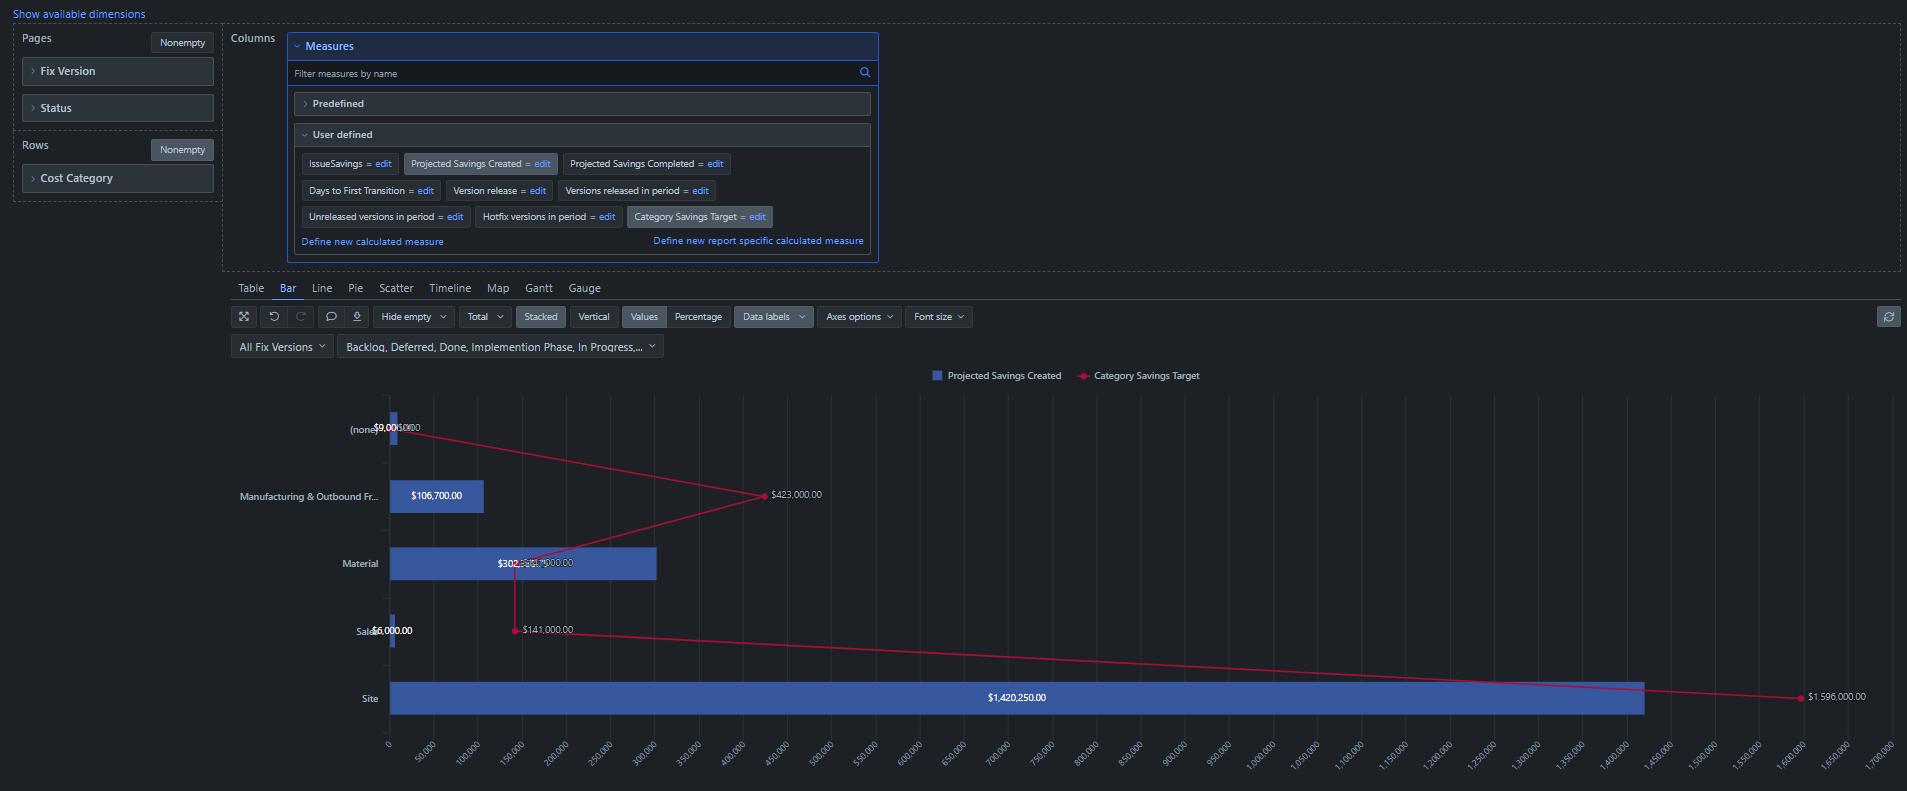
I need to add a target line to a bar chart based on a custom dimension field called “Cost Category”. I created a user defined measure called “Category Savings Target”. Based on another topic I was able to figure out how to set the target based on the category value as follows:
CASE
WHEN [Cost Category].CurrentMember.Name = "Site"
THEN 1596000
WHEN [Cost Category].CurrentMember.Name = "Manufacturing & Outbound Freight"
THEN 423000
WHEN [Cost Category].CurrentMember.Name = "Material"
THEN 141000
WHEN [Cost Category].CurrentMember.Name = "Sales"
THEN 141000
ELSE 0
END
The result looks as follows and is super close to what I need:
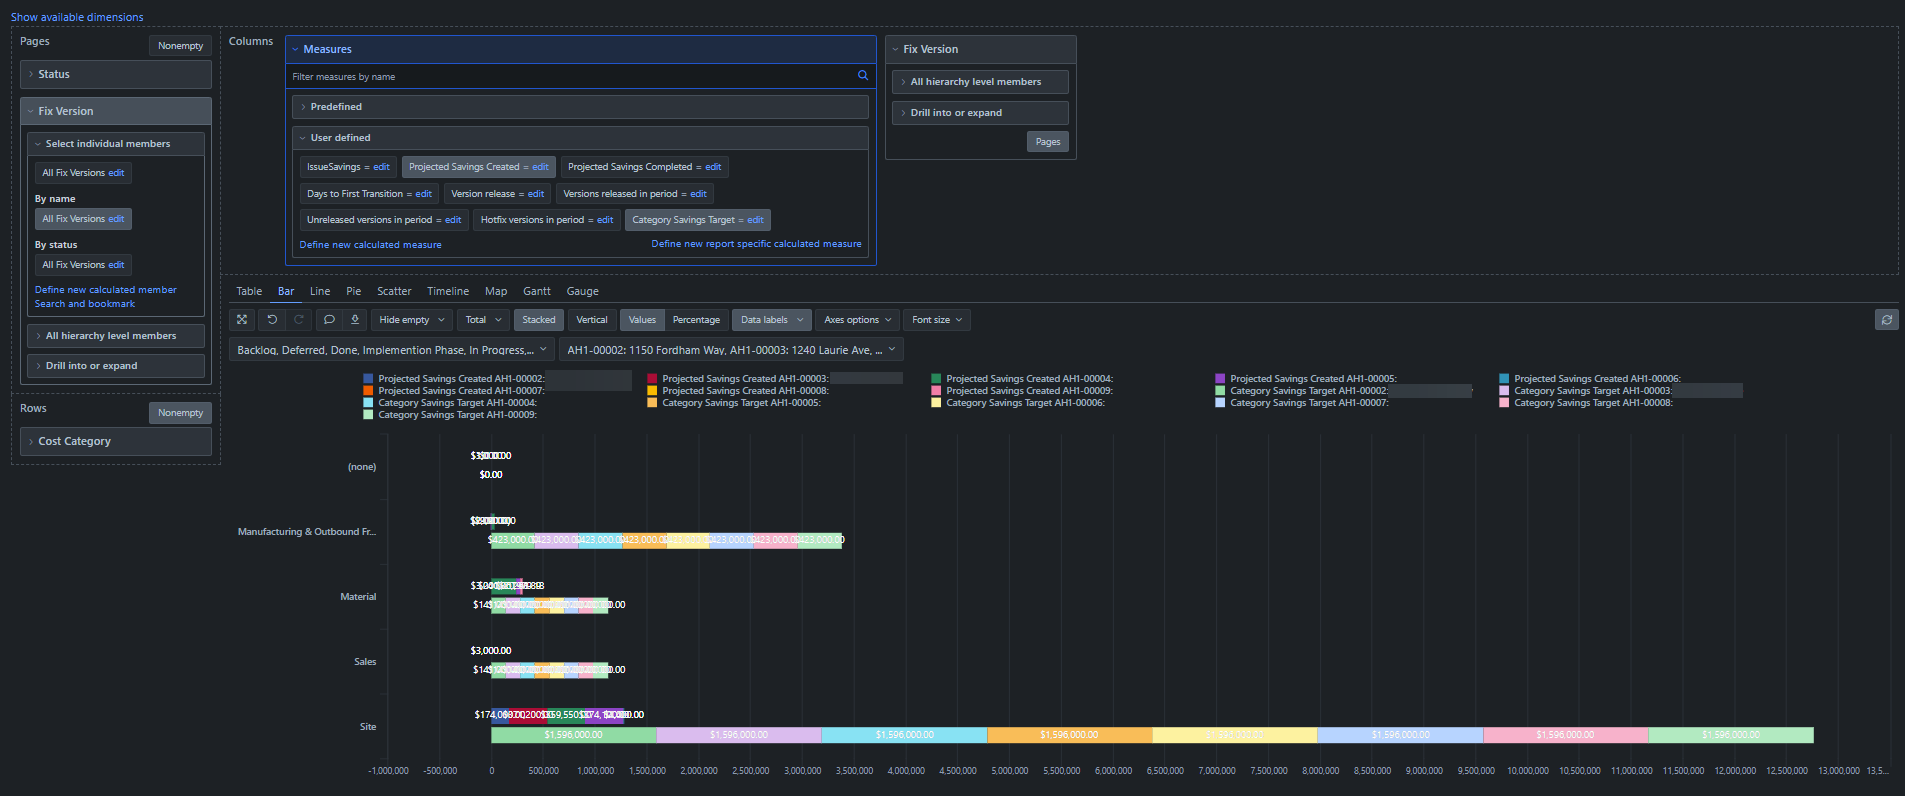
My problem is that I also need to break down each cost category by “Fix Version” as a stacked bar to show how each version adds up to the target. When I do that, my target repeats for every selected member. I know I’m missing something in my calculated measure and how it interacts with the dimension, but it’s beyond my understanding of the data structure to figure out. Can someone please help guide me here?
I’ll add the second screenshot in a reply since I can only post one…