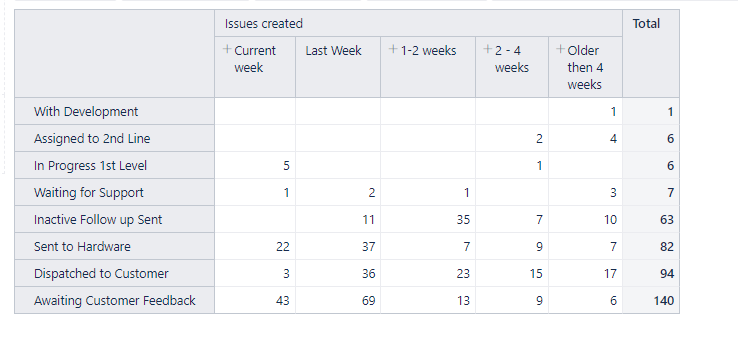
I’ve got a table which is showing me the Current status of issues created across time periods
I’m trying to get the values into a Percentages across the rows, I’ve tried some of the calculations suggested in other topic but i cant see to get any of them to work - does anyone have any suggestions?
Thanks
Hi @rdersley,
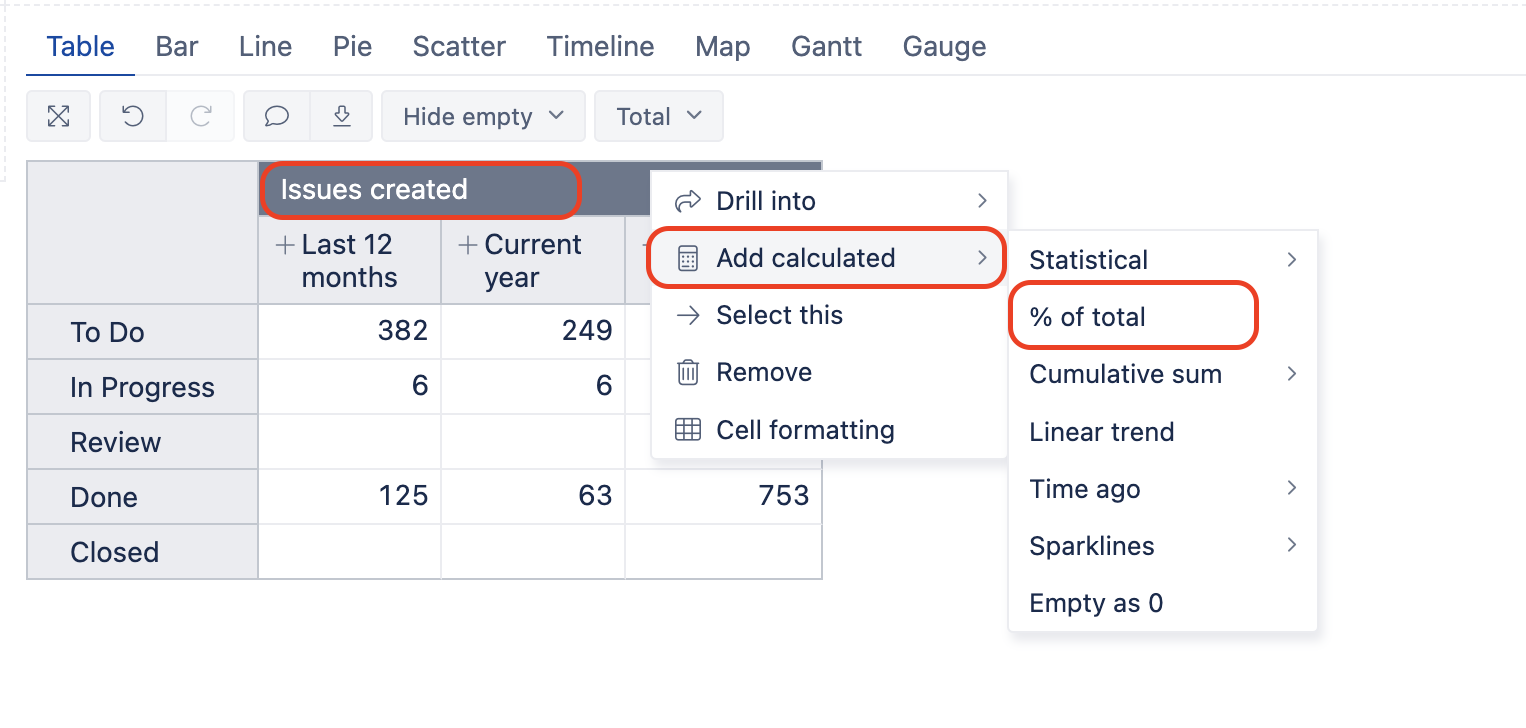
There is a standard calculation (like percentage of the total across rows, cumulative sum, and others) that you can add to the report.
On the table, click on the measure “Issues created” name and choose the option Add calculated → % of total.
More details in the documentation: Create reports.
Best,
Zane / support@eazyBI.com
Zane - Thanks for the reply but I’m looking for the percentages of the rows not the columns as that produces - nothing I’ve tried works as even when i try a defined measure the totals never work out correctly
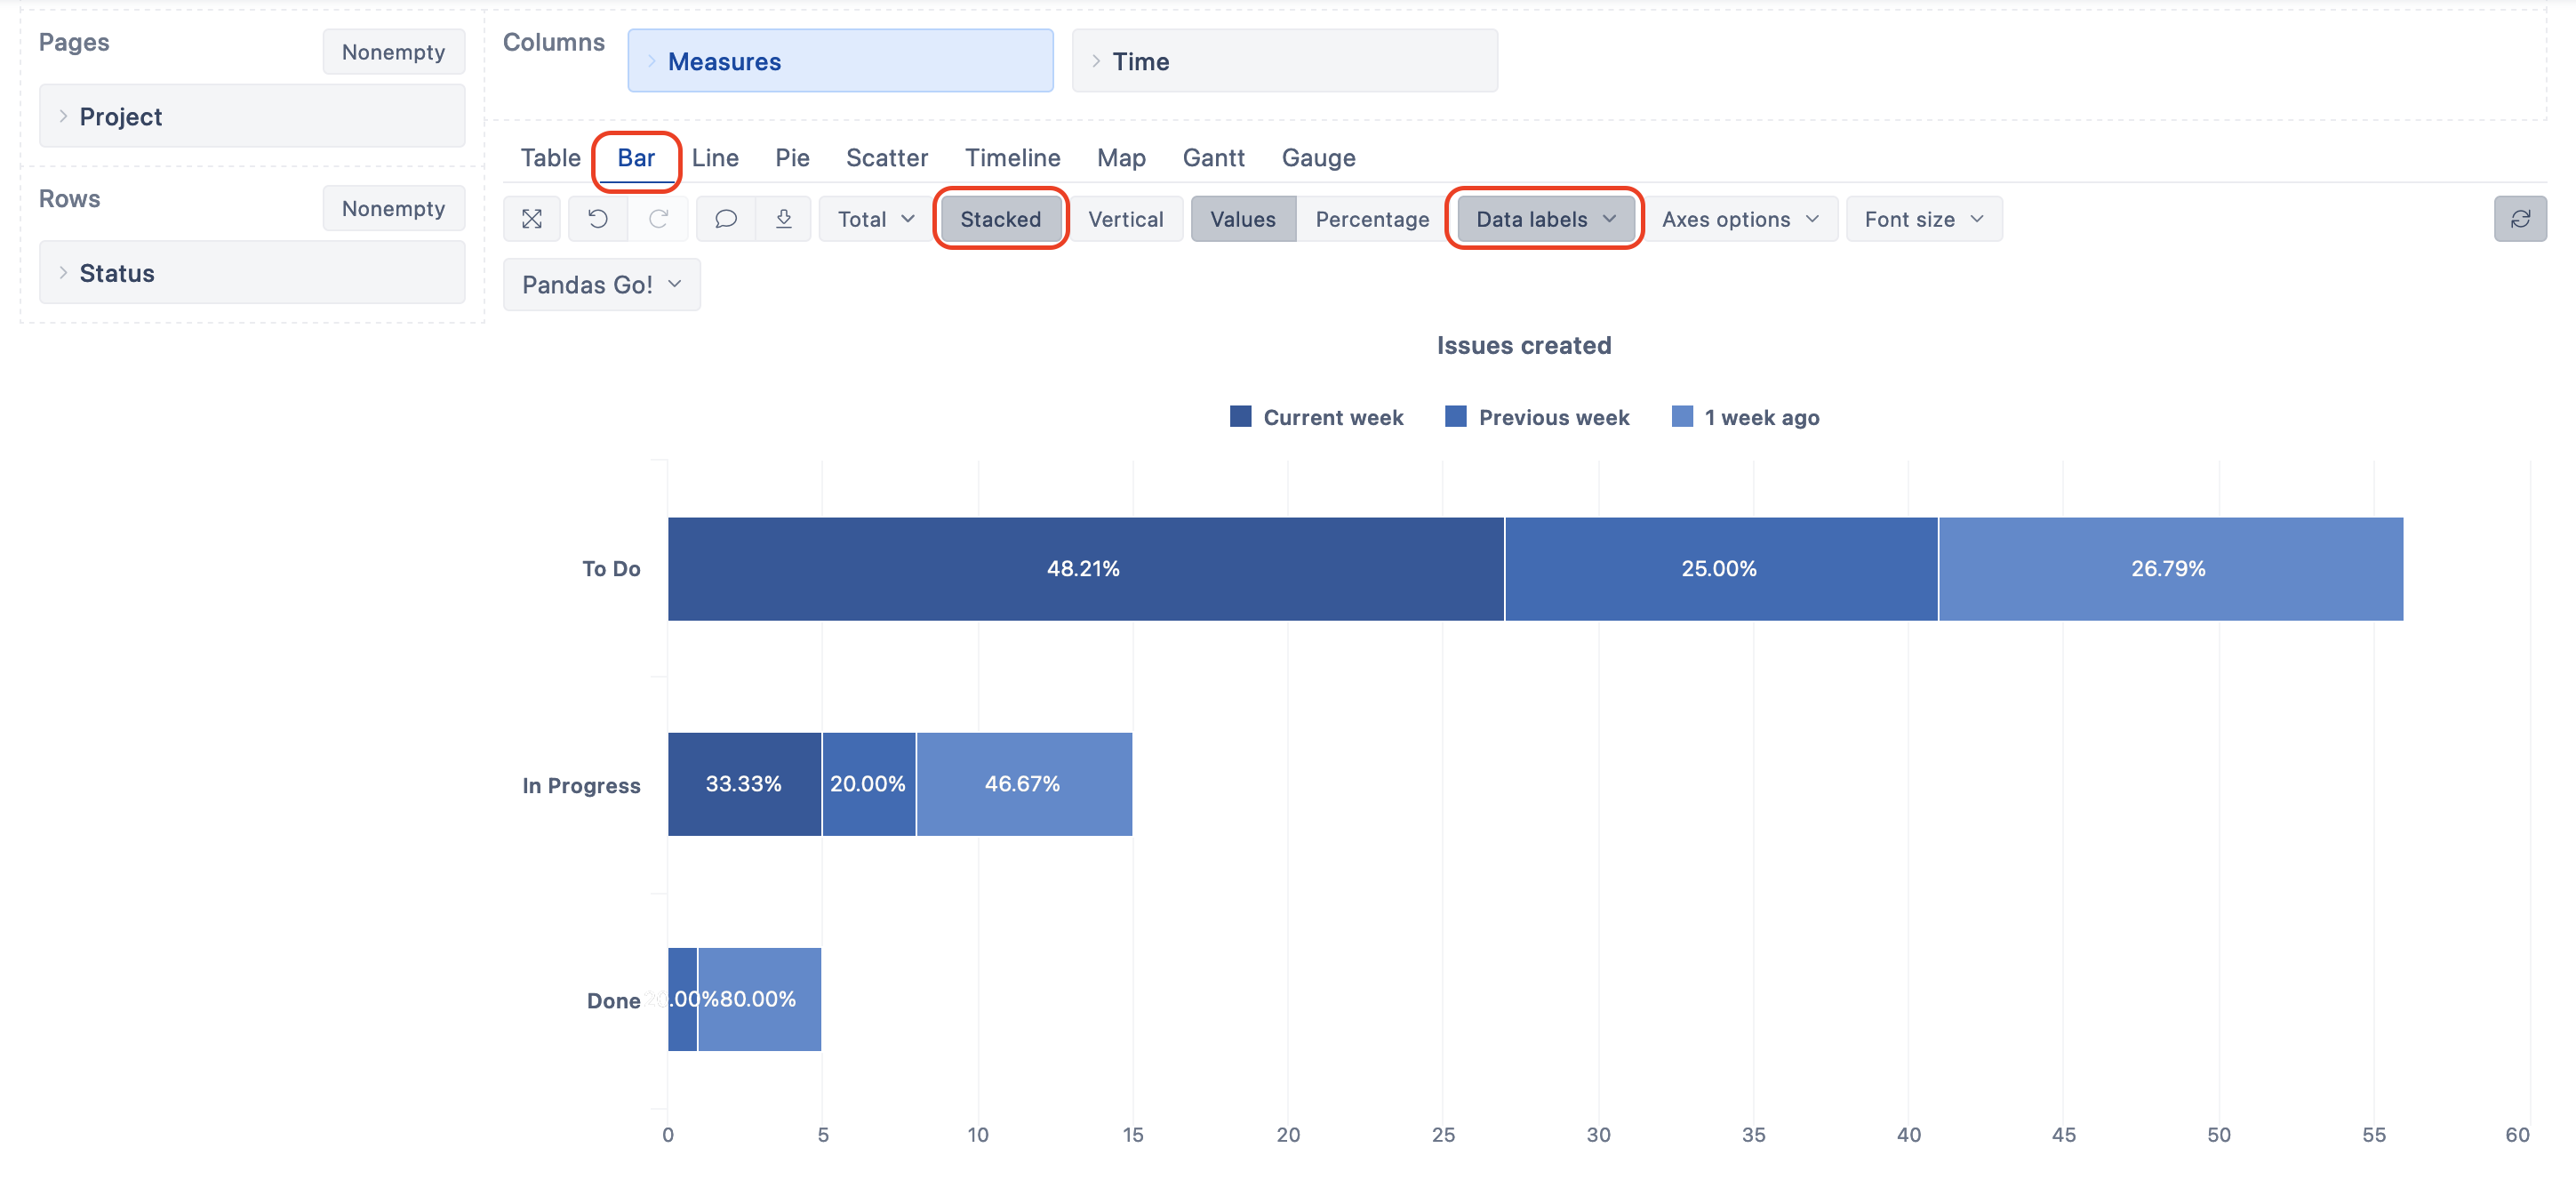
I recommend another approach with data representation in the Bar chart or Pie chartto see the relative proportion of created issues by columns. Both charts offer data representation as values and also as percentages by default.
For instance, in the bar chart, you can show created issues as stacked columns and show their size in percentage.
The Alternative solution is a new calculated measure in Measures for calculating percentages. The expression for calculation might look like this:
-- created issue count in each period
[Measures].[Issues created]
/
-- divided by issue count created in all selected Periods on report columns
Sum(
  Generate(
    VisibleColumnsSet(),
    [Time].CurrentHierarchyMember),
  [Measures].[Issues created]
)
Set measure formatting to Decimal percentage %.
More details on calculated measures and how to set formatting are described in the documentation: Calculated measures.
Best,
Zane / support@eazyBI.com