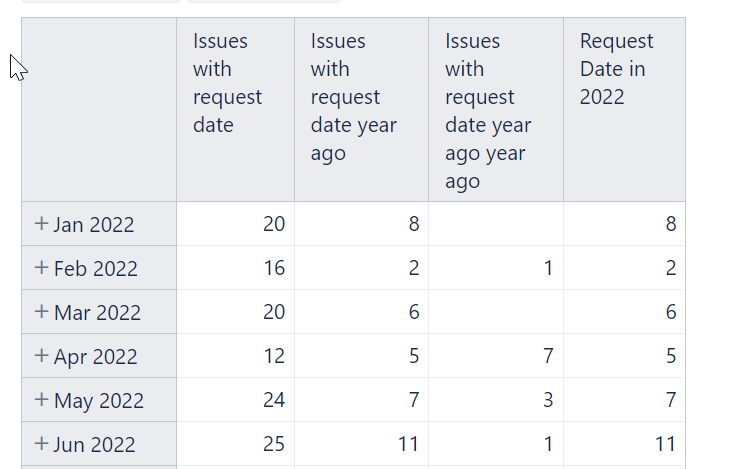
I want to create a table that shows month by month how many issues have the request date in 2022, 2021, …
The table I have created shows only the number of issues with the request date in a certain month from the last year (e.g. # issues wit request date in Jan 2022 or Jan 2021) not the number of issues of the whole year.
Can anyone help here?
What you have described is intended eazyBI functionality; measure “Issues with request date” groups issues by request date on the timeline.
In eazyBI, there is only one “Time” dimension, and each measure is related to it differently.
Suppose you want to use the “Time” dimension by two means in the report – show unresolved issue count on the Timeline and group issues by the year or request date, then yuo should use another approach to the report.
I recommend importing the request year ar new dimension using calculated custom fields (see details here: New calculated fields).
Add a new calculated field in import options, tab Custom fields. Provide custom field details:
Internal name without any spaces or special marks, it works as an identifier. For example, requestyear.
Display name as you would like to see the dimension. For example, “Request year”.
Set data type “String”.
Mark option “Dimension”.
In the custom JavaScript area, paste the code to find the request date for each issue and take only the year out of the whole date. The code might look like this where NNNNN is the request date field id in Jira.
if (issue.fields.customfield_NNNNN) {
  return issue.fields.customfield_NNNNN.substr(0,4)
}
Mark the new field for data import as a dimension and import data
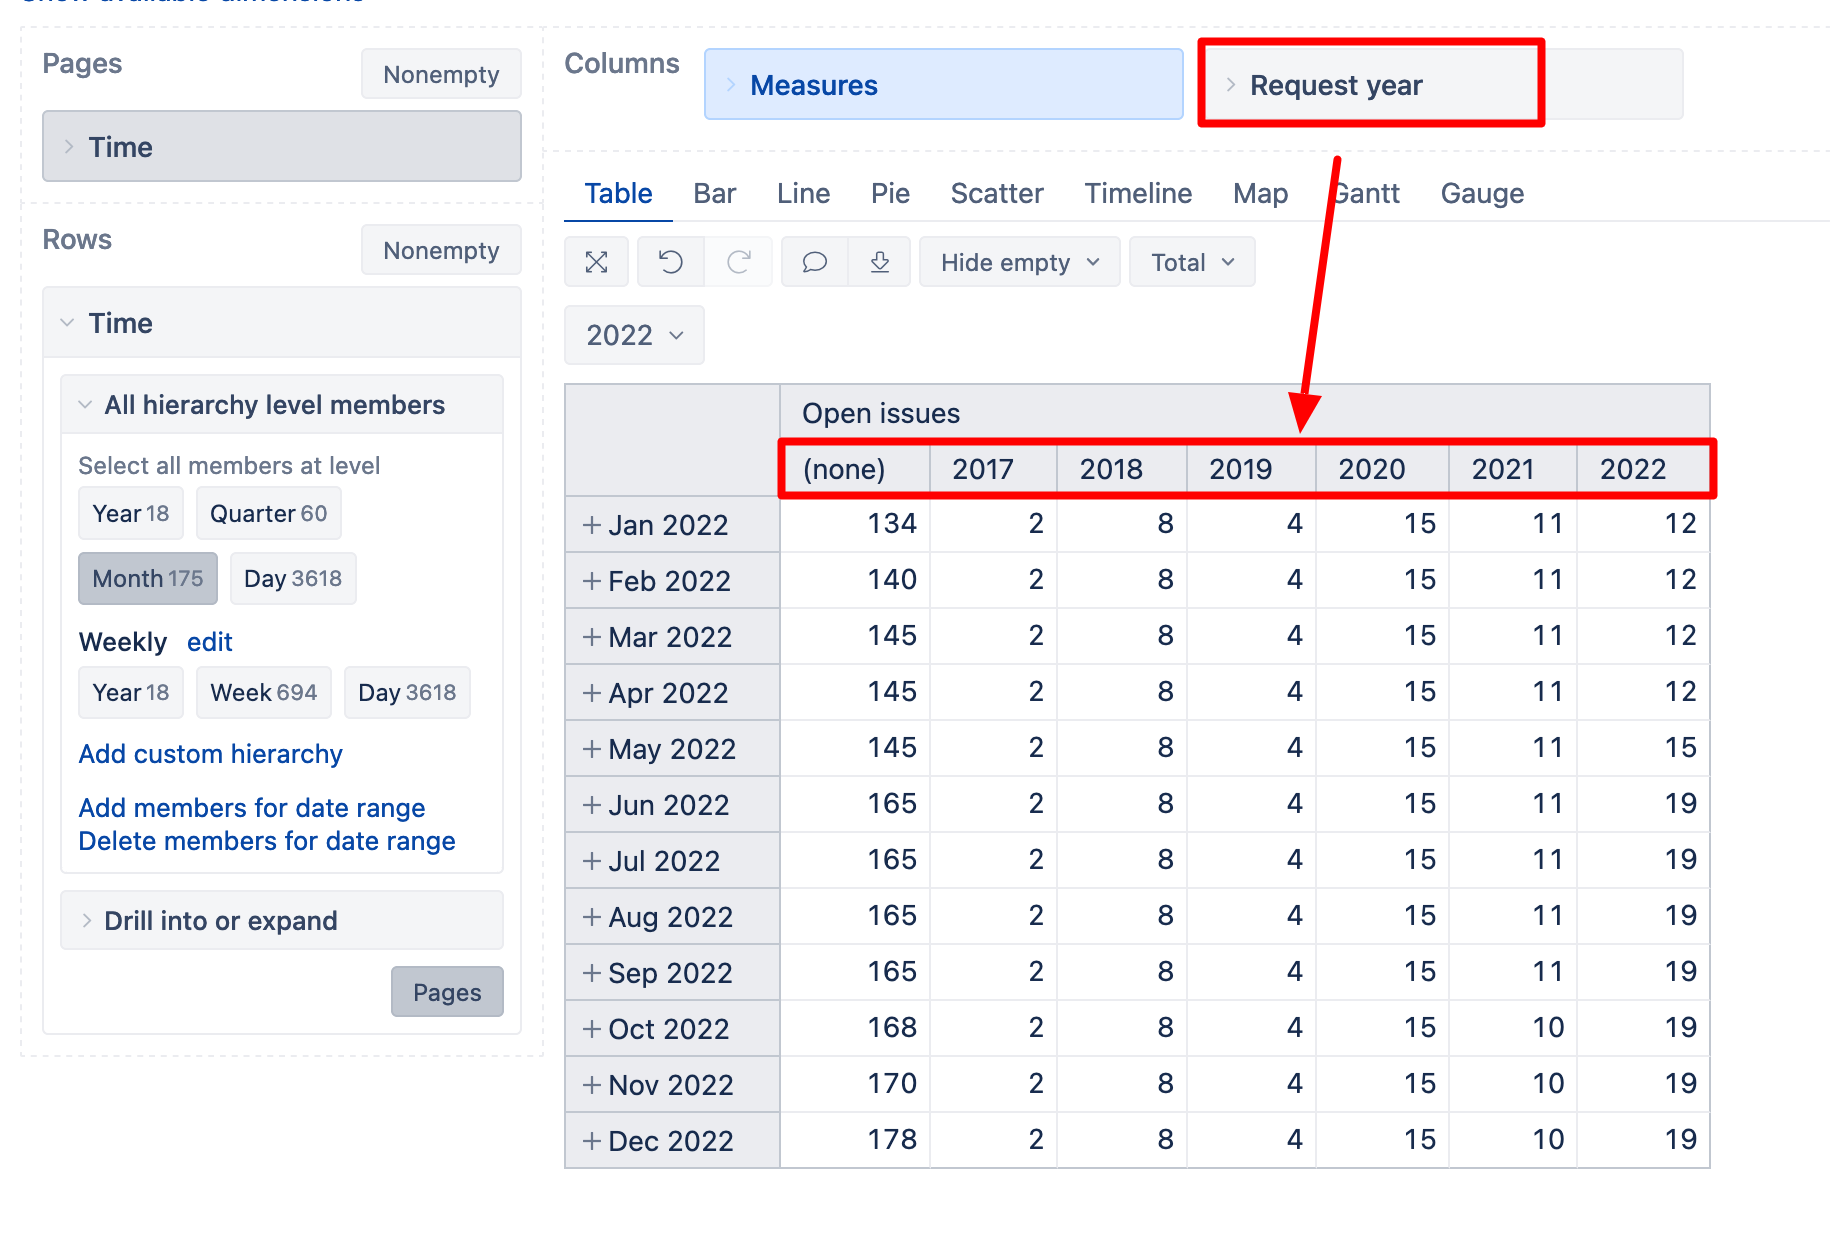
In the report, use the new dimension “Request year” on the report columns along with the measure for which you want to see the trend (see picture below).