Dear support,
I would like to see the versions report on a quarterly interval. I did select the Quarter member in the row but then it still shows the start of the quarter month iso the quarter like Q1 2022 it shows Jan 2022. How can I get the quarter labels ?
(Version releases - Issues - Jira Demo - eazyBI)
When I select the table view it does show the quarters.
Thanks in advance and kind regards
Jurgen
Hi @Jlf4EazyBi
You did it right by selecting the Quarter level on the report rows to aggregate versions and data by quarters.
However, the report is visualized on the Timeline chart where date labels are generated automatically and usually show year, year and month, or the exact date (grouping is similar to calendar view).
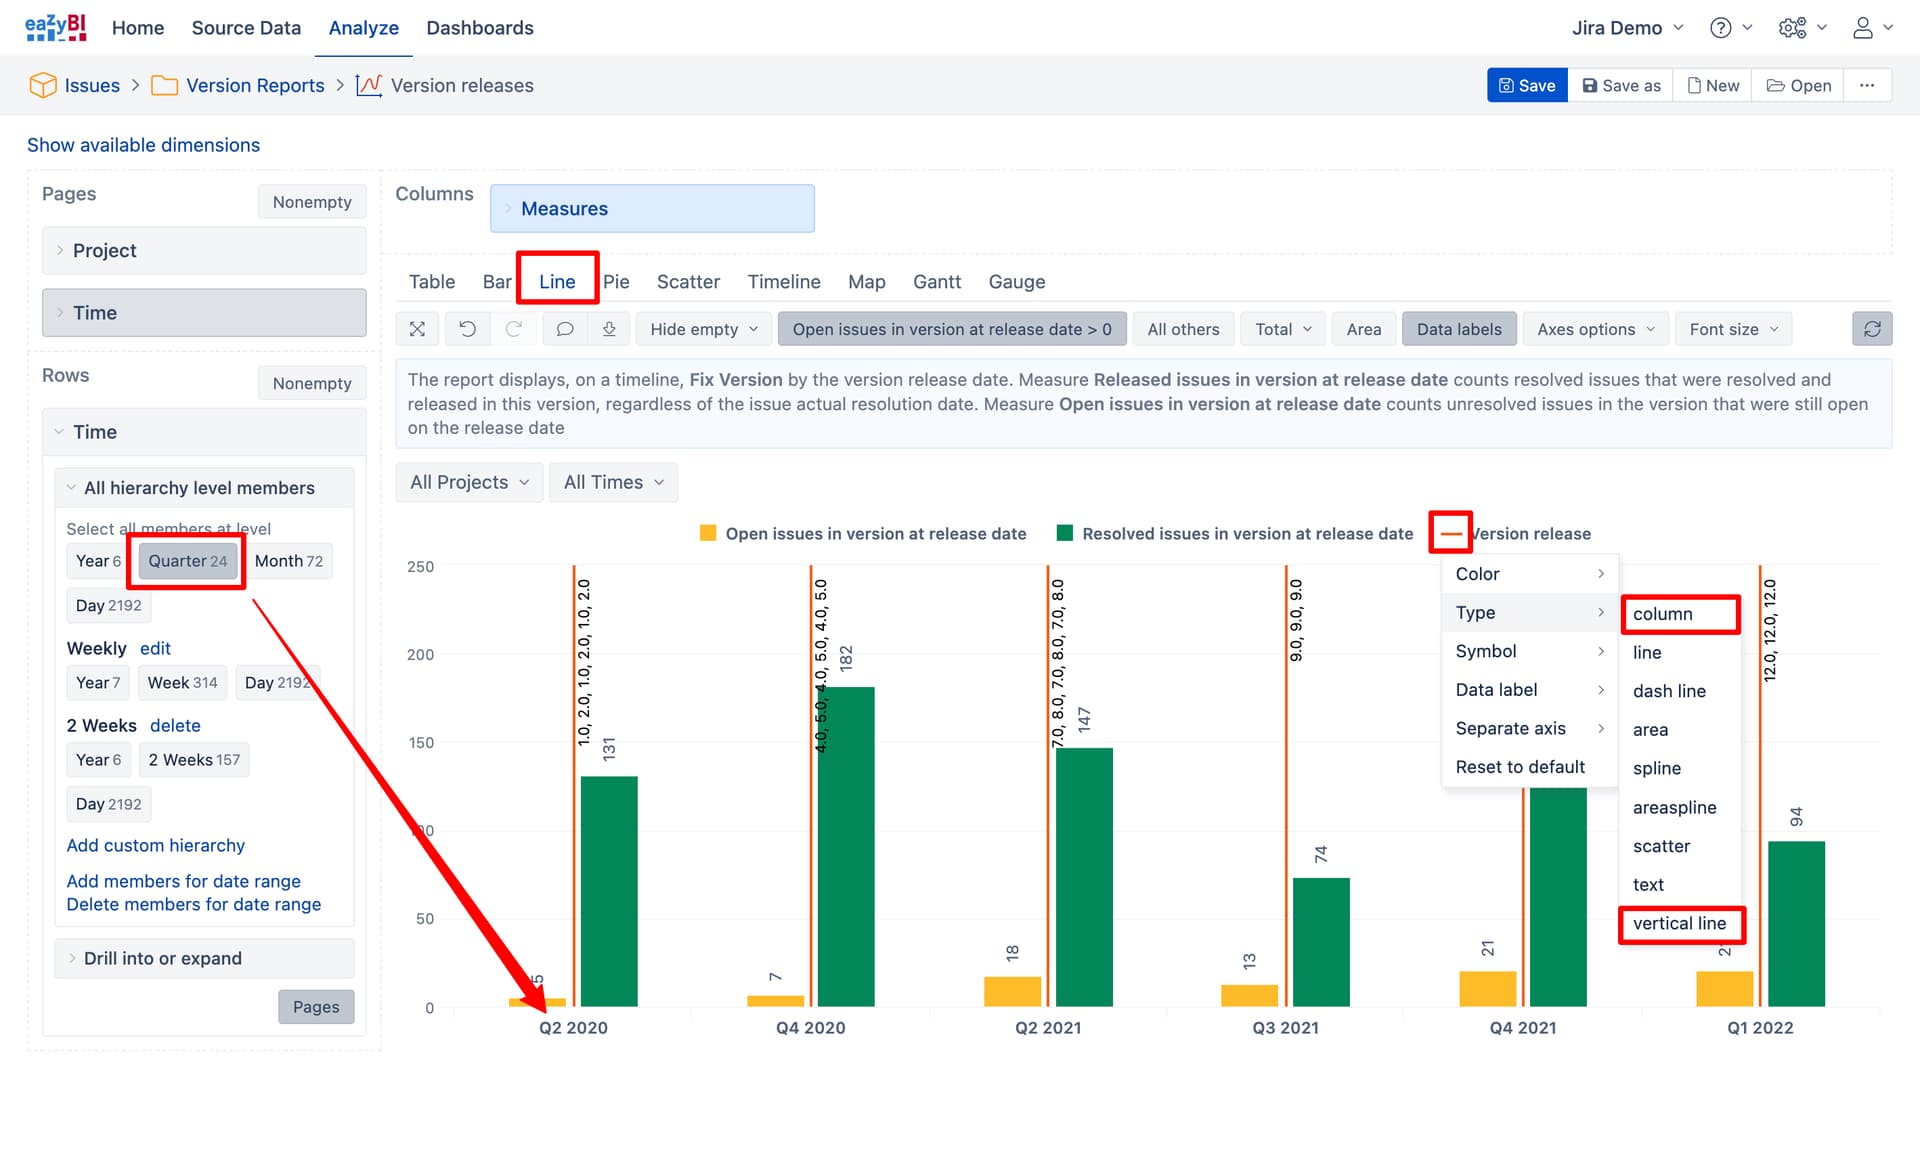
You might want o switch to the Line chart to see labels exactly as dimension member names on rows, for example, the quarter name "Q1 2022.
Then change the chart representation type for each metric; set column for Open and released issue count and vertical line for release dates. The modified report might look like in the picture below:
More details on differences between different charts and chart customizations are described in the documentation:
Best,
Zane / support@eazyBI.com
Thanks Zane. Quick turnaround and great solution.
1 Like