![]() This community post is a more detailed version with many examples on Troubleshooting report data. The main purpose is to find and fix the cause if the report outcome does not match the expected results.
This community post is a more detailed version with many examples on Troubleshooting report data. The main purpose is to find and fix the cause if the report outcome does not match the expected results.
Systematic method
There is no guessing or luck–troubleshooting is a systematic method you can apply following the prescribed steps.
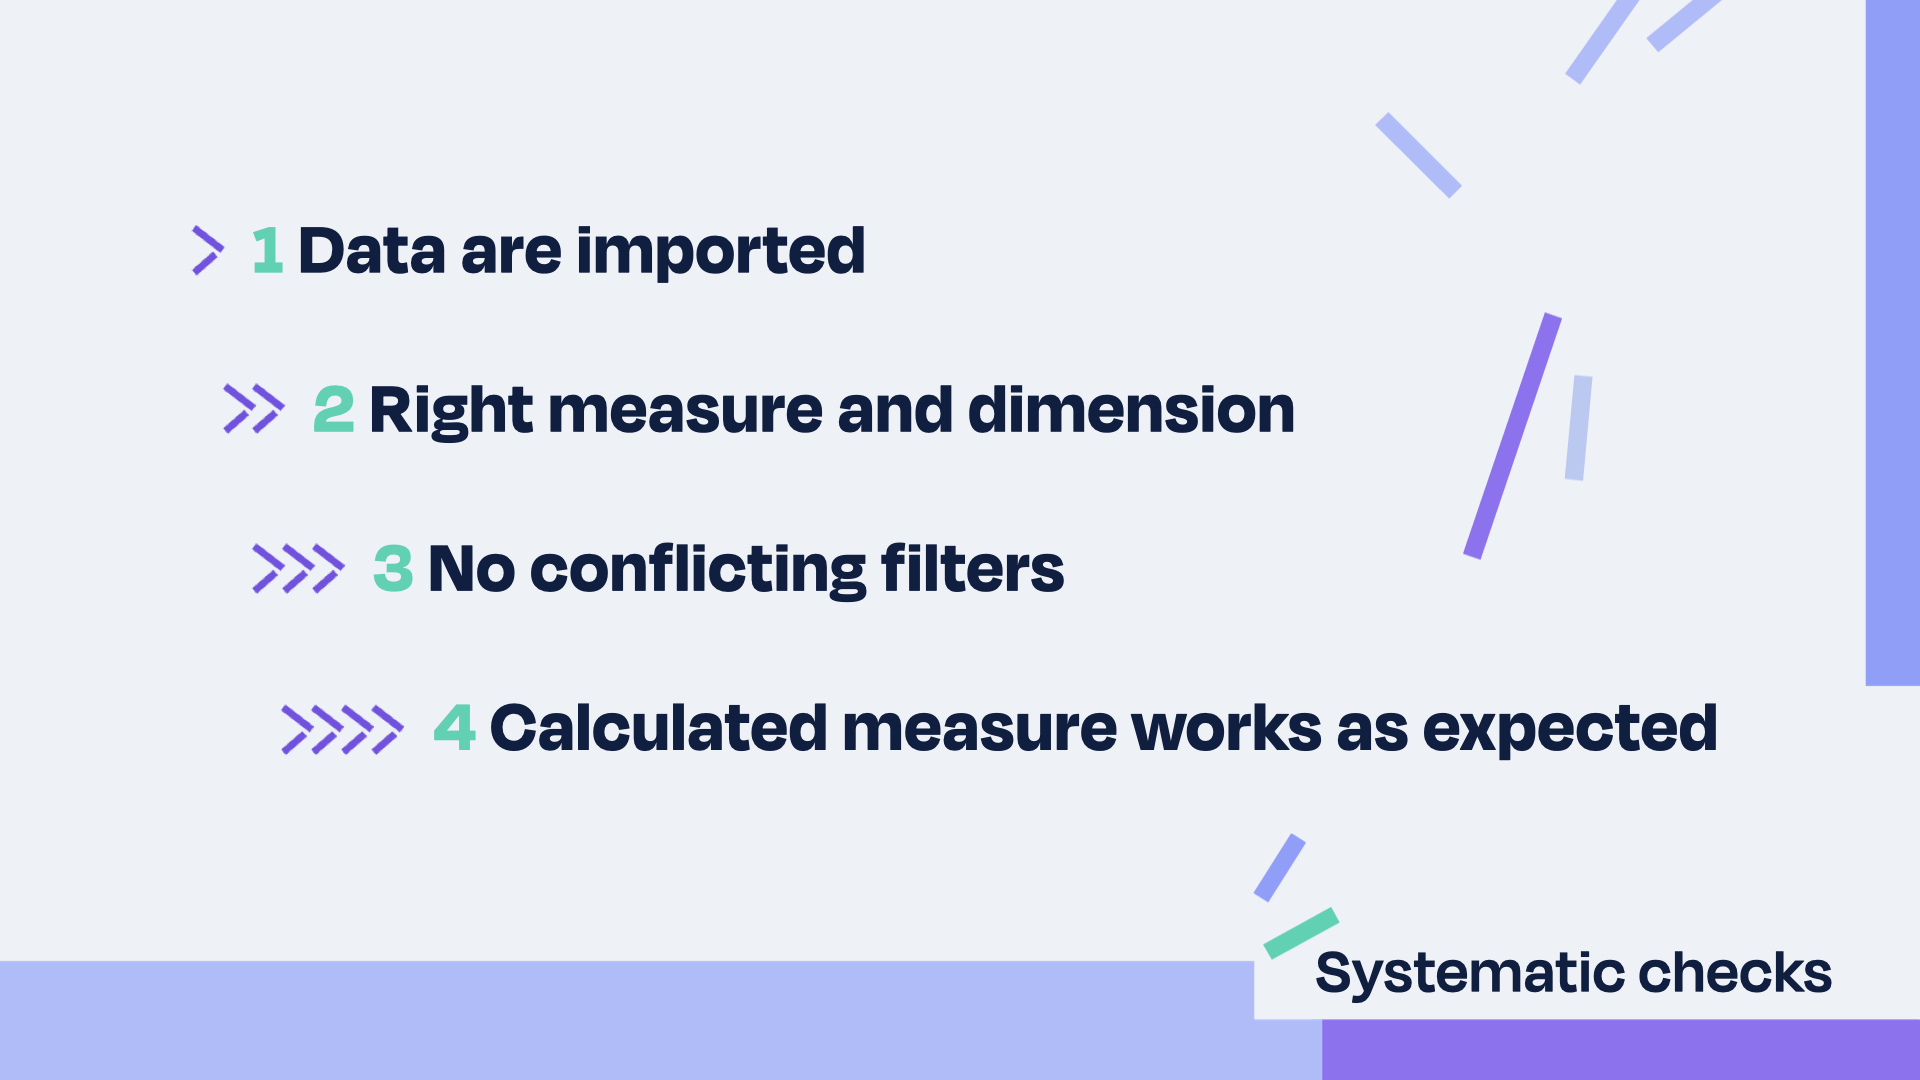
Below is the recommended order, as the first steps require less time to check and also provide a good base for ensuring that you have all the required components: the data are imported and the correct measures and dimensions are selected for the report.
- Is the data imported?
- No, not imported → check the last import time and read error messages if the import failed.
- Yes, the data are up to date → proceed with the next step
- Is the measure and dimension combination the right combination for the job?
- No, I have doubts about the selected measures and measures → read the documentation explaining how predefined measures and dimensions work. If this is user defined measure, then you will return to the issue in the 4th step.
- Yes, I understand what the selected measures represent in the report → proceed with the next step.
- Check if the report has any conflicting filters
- Remove filters one by one.
- Test data on a single issue without any filters.
- Calculated measure works as expected in case of user-defined measures or calcauted members in dimensions.
1. Is data imported?
1.1. Mind the gap!
eazyBI is a non-real-time tool. Data are refreshed based on a schedule. Usually once a day.
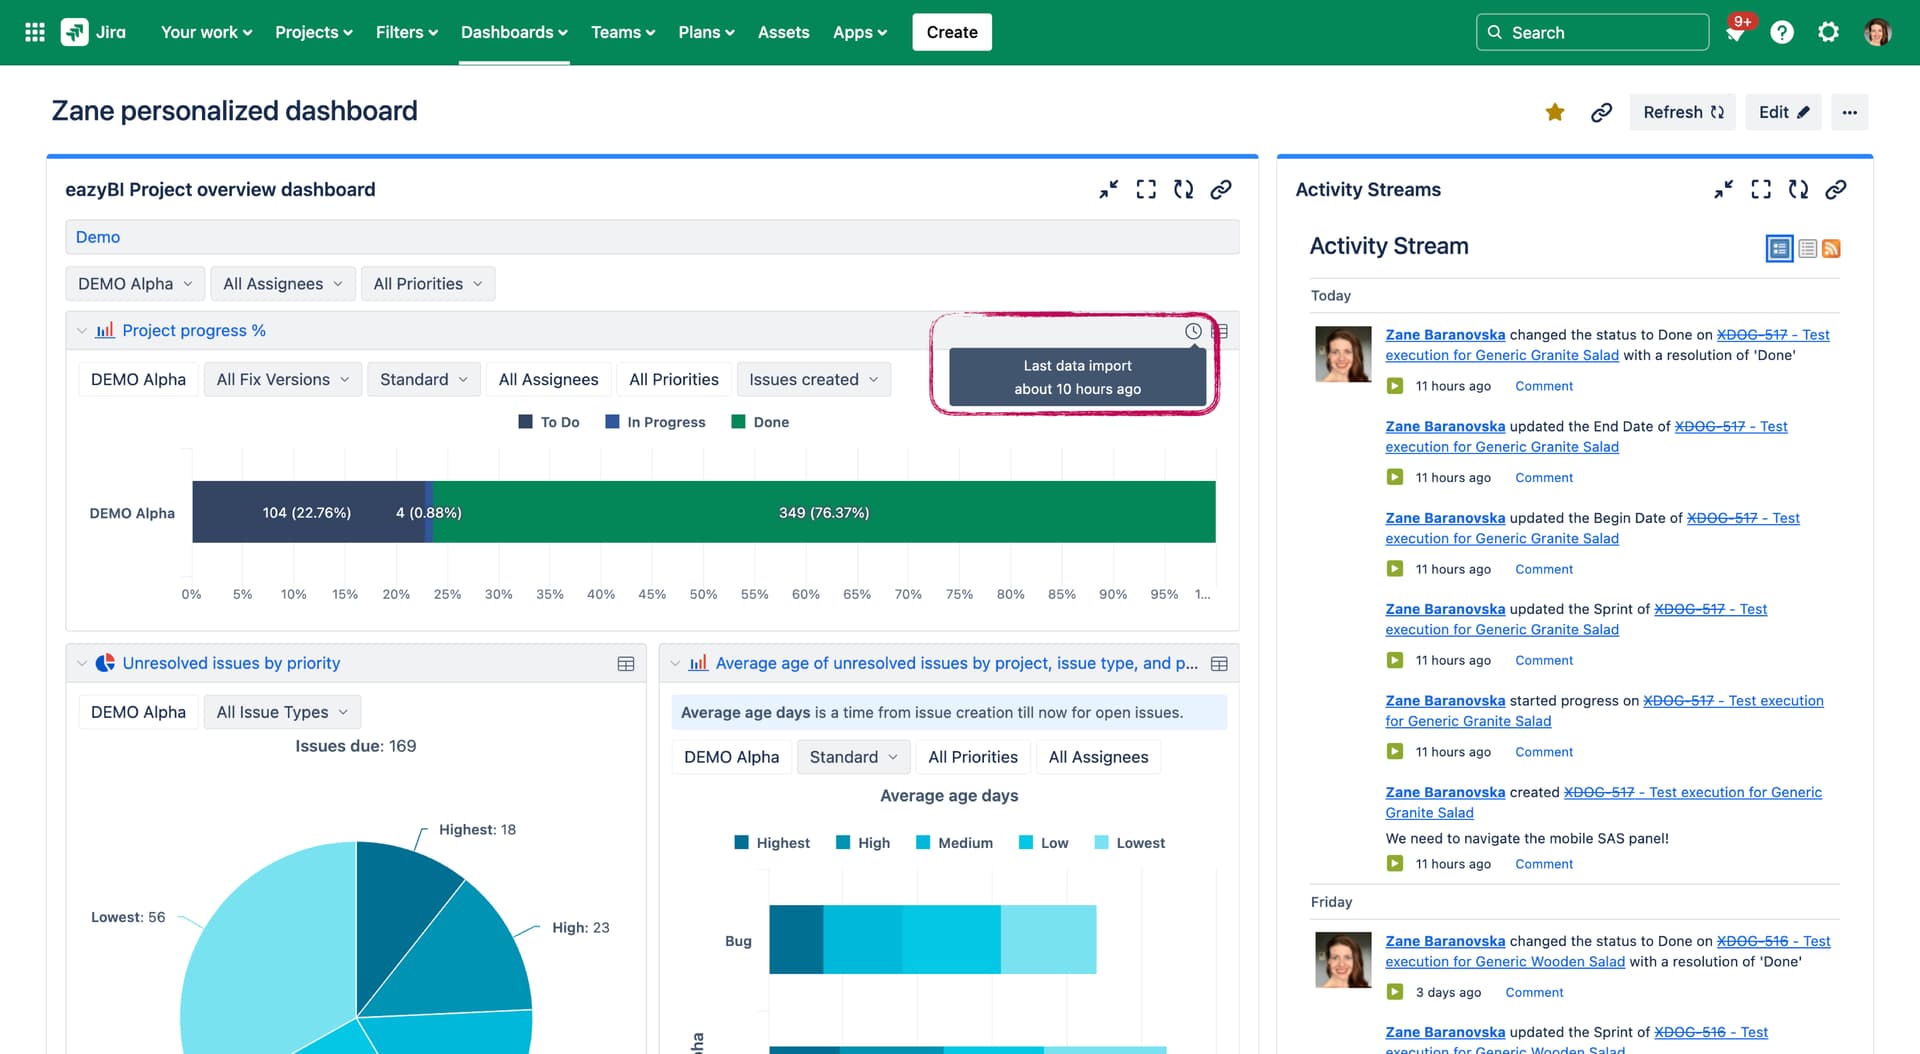
Any user can see the last data import in the Dashboard:
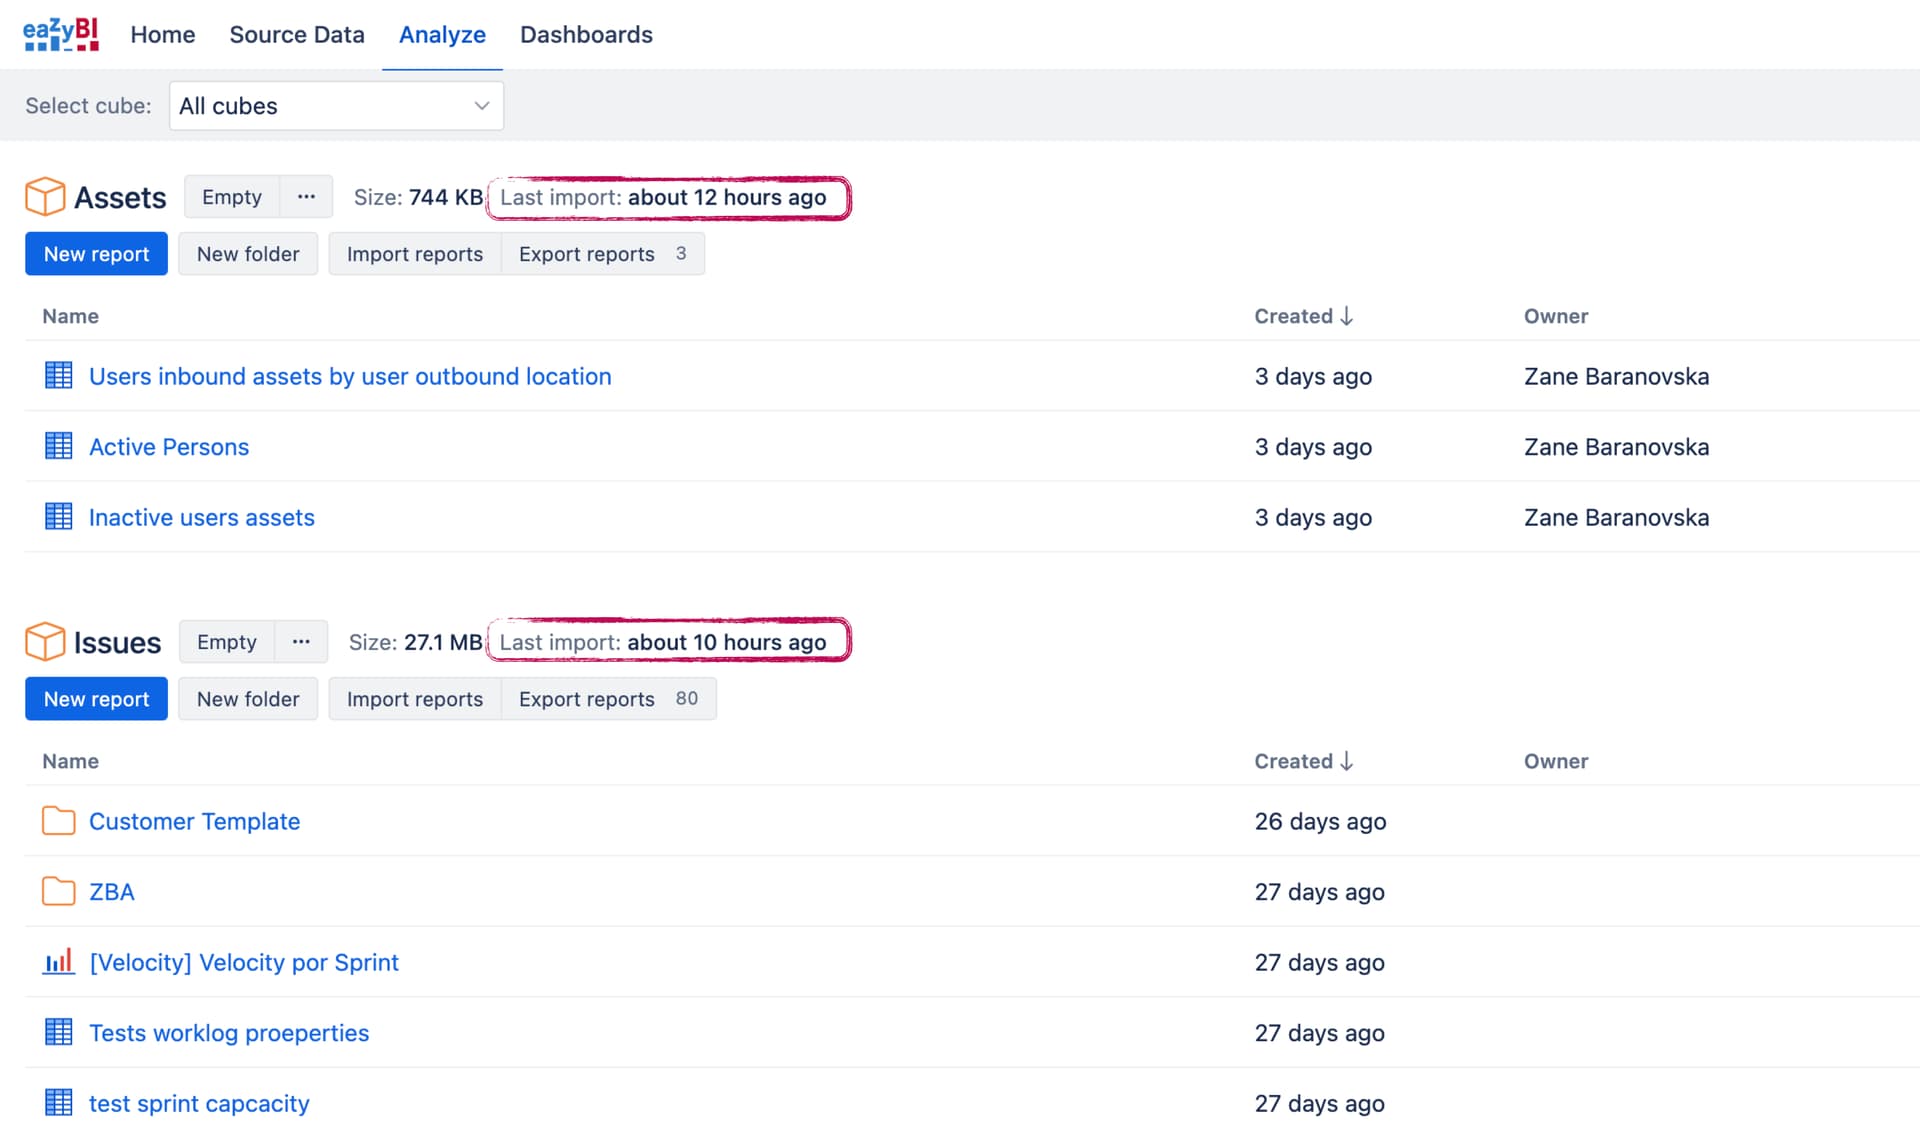
Users who can build reports can see the last import time in Analyse:
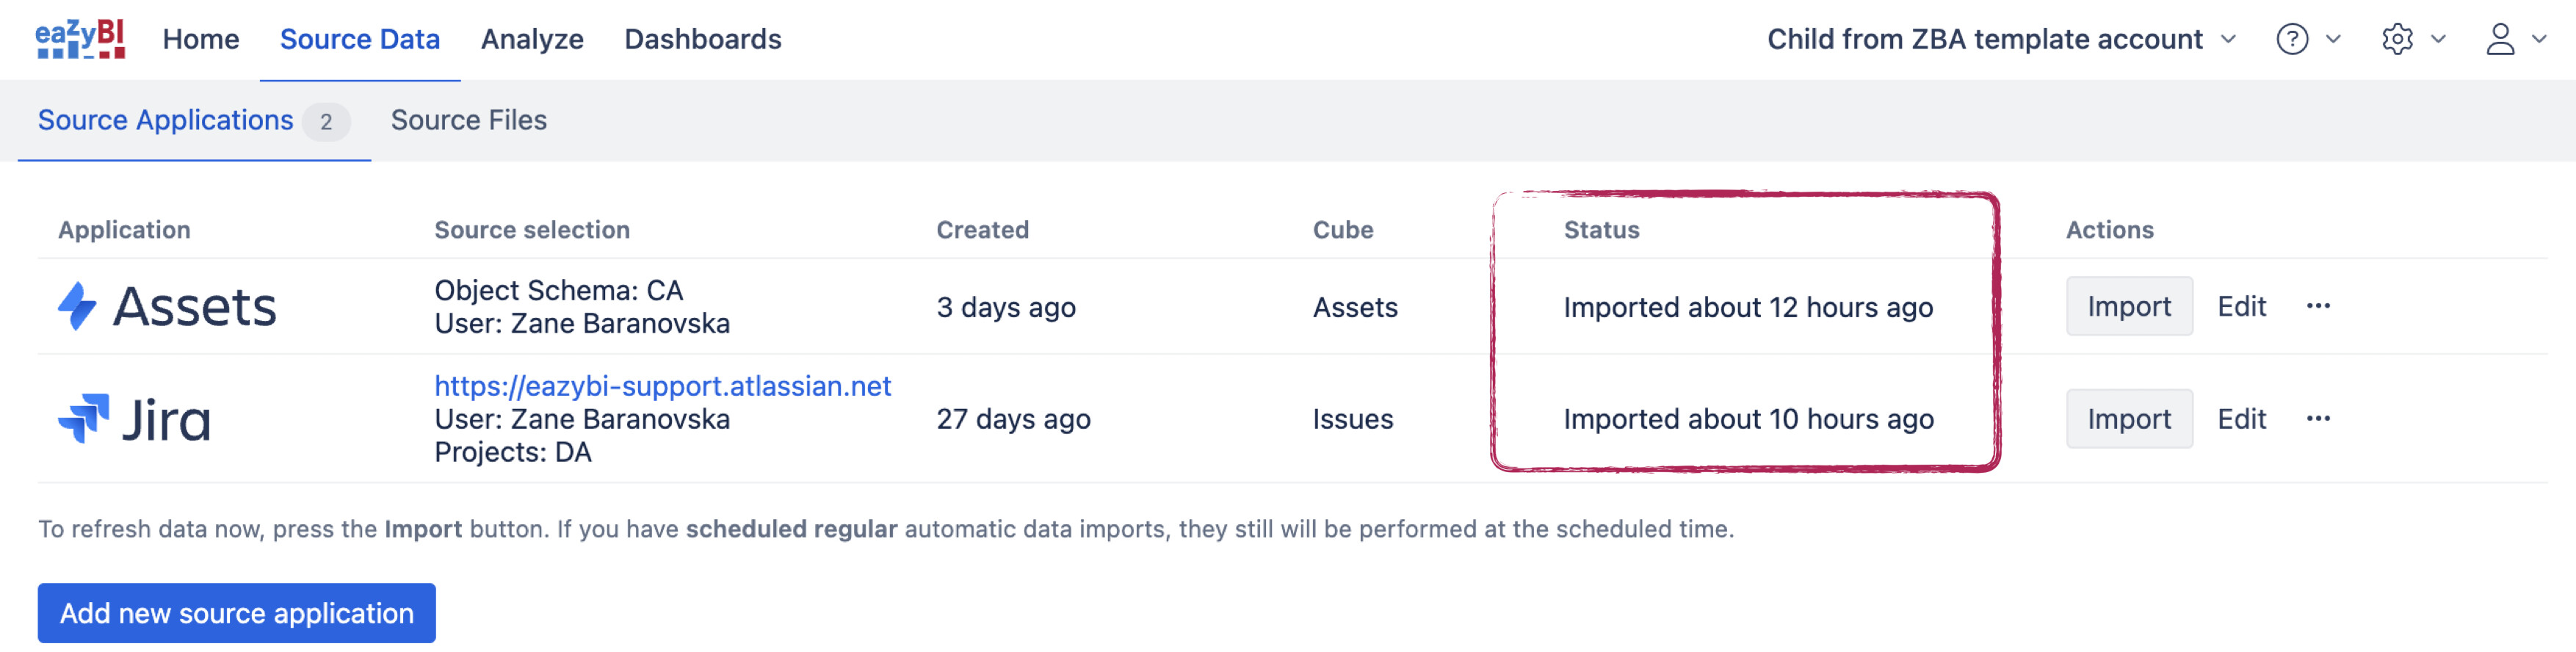
eazyBI Data admins and users with higher roles can see the last import status in Source Data.
1.2. Read import error messages and warnings
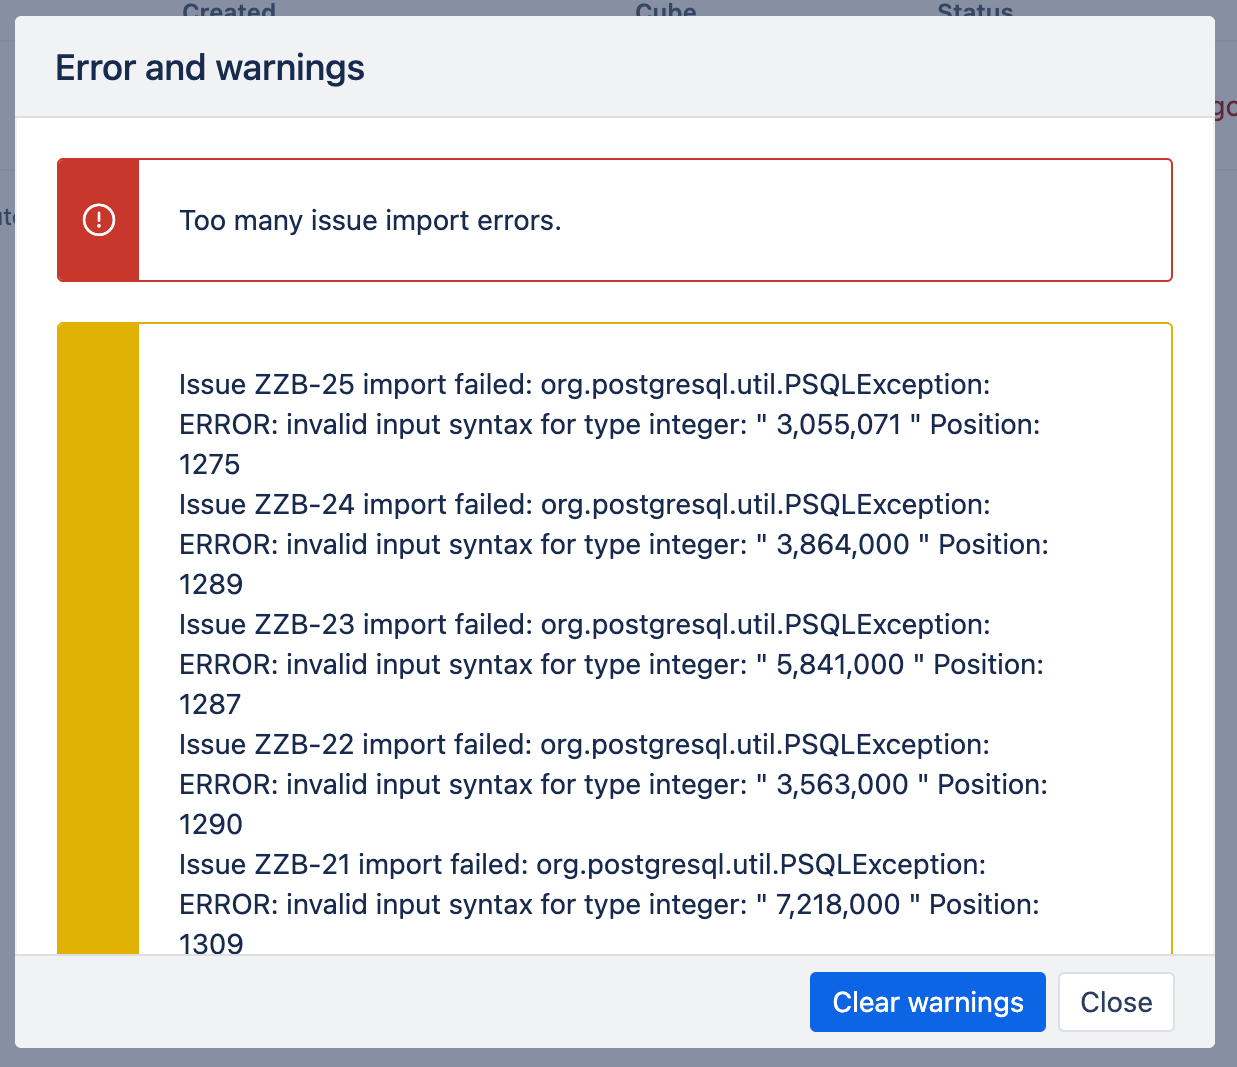
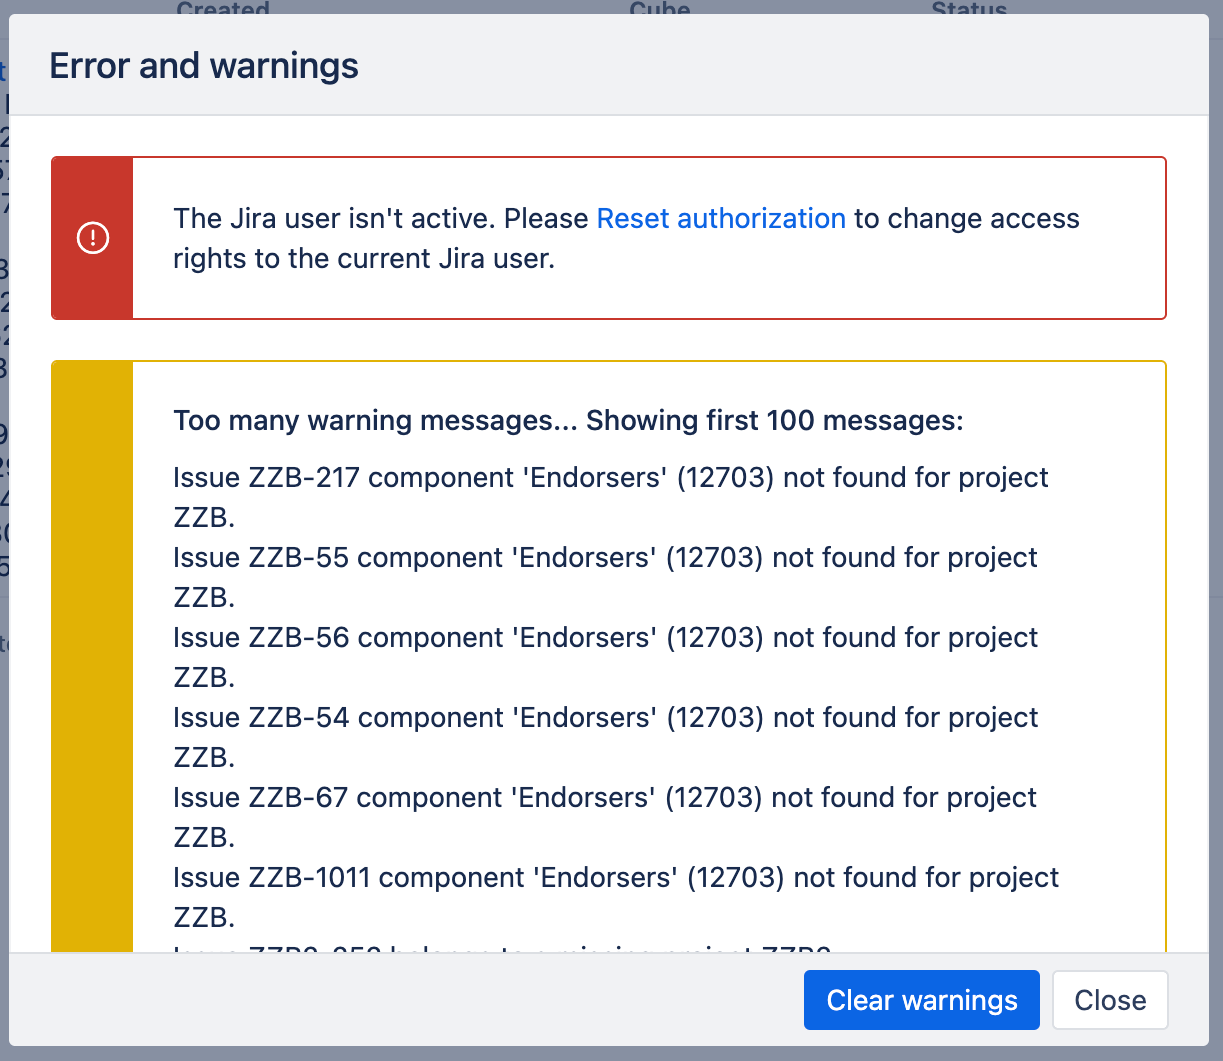
If data import failed, read the error messages. The message will indicate the cause of the failure, so you can act upon it and restore data import. A data admin or user with a higher role can see more details in the Source Data section.
Here are several examples with common use cases:
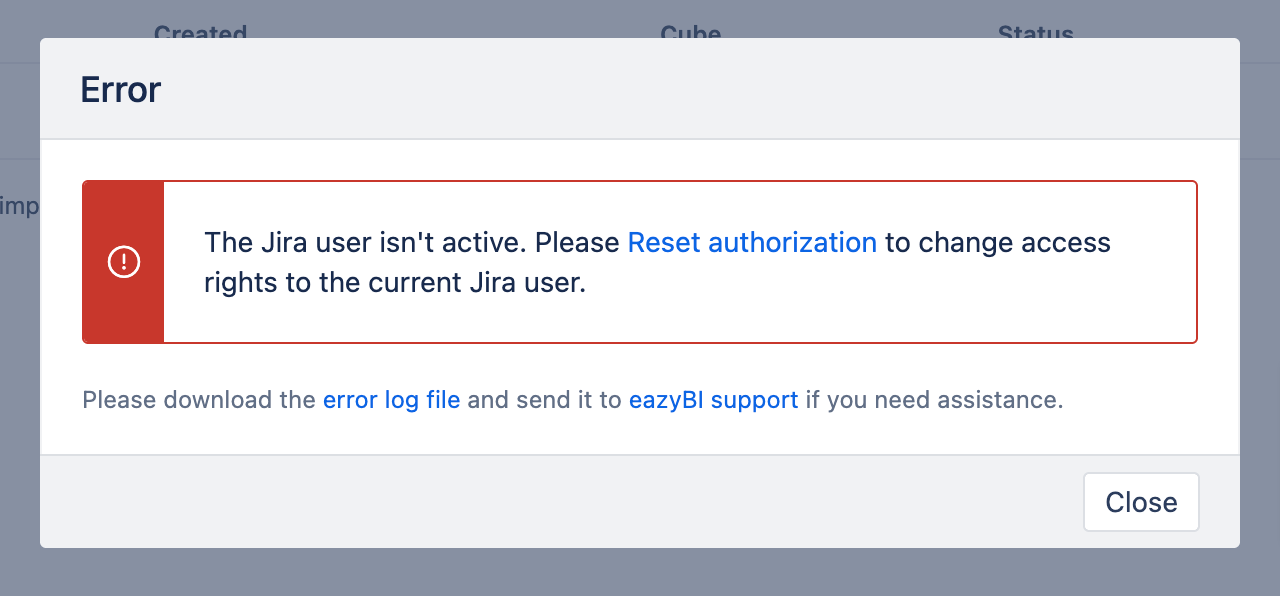
-
A solution for the example: Reset authorization
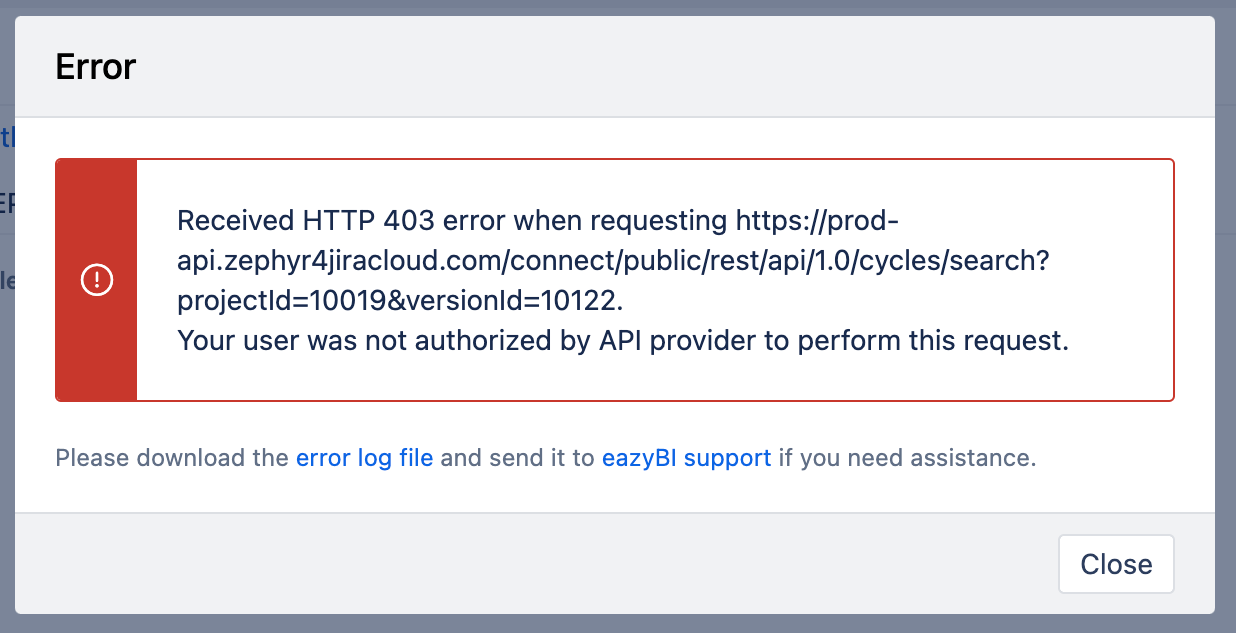
-
A solution for the example: Edit import options and use another API token to authorize data import for the 3rd party app like Zephyr Scale.
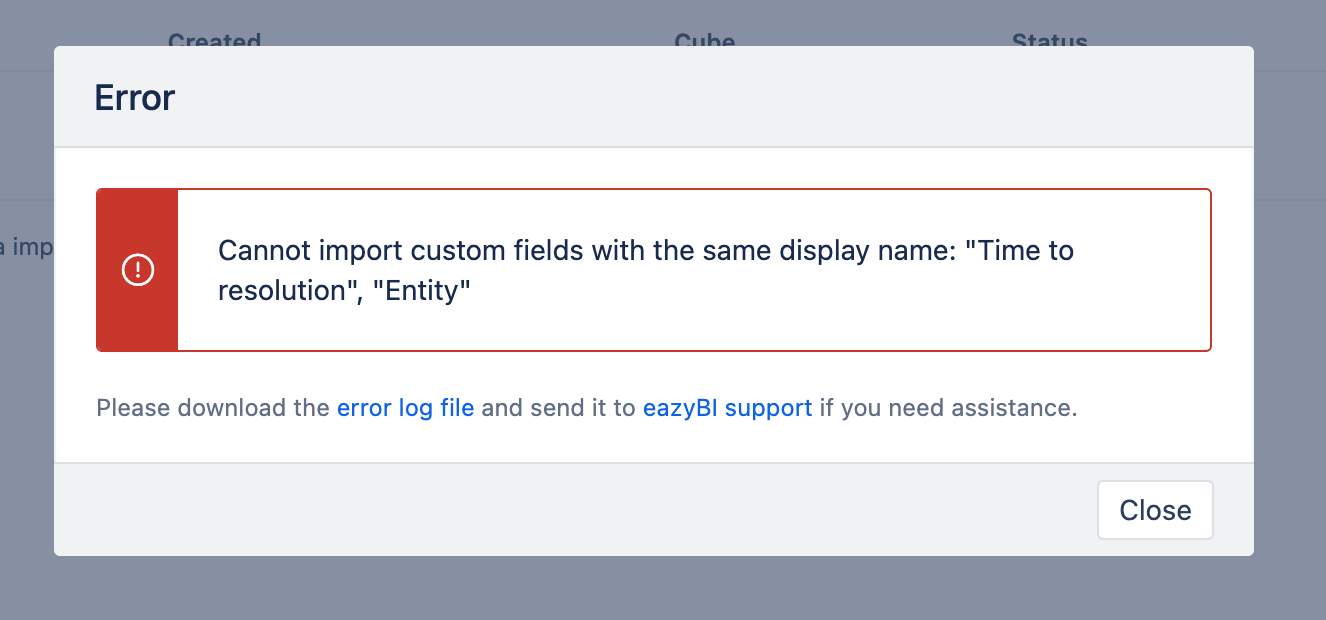
-
A solution for the example: Edit import options and rename one of the custom fields to have a unique name.
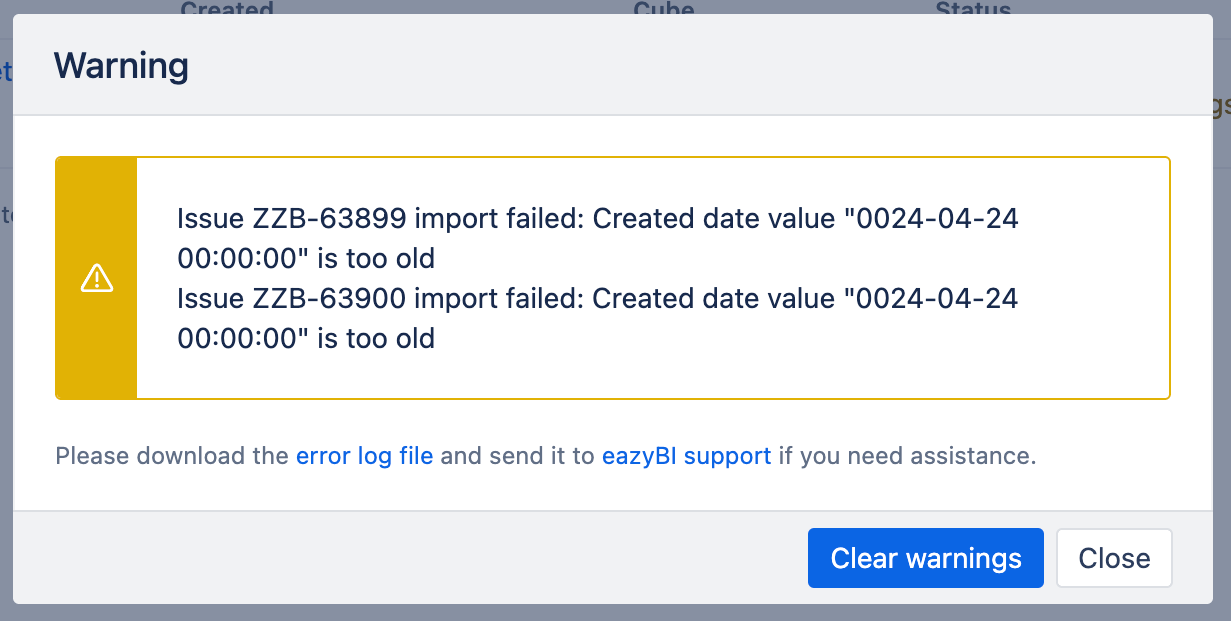
-
A solution for the example: Update failing issue data in Jira. If you can not change the date, contact Atlassian Support.
-
Solution, for example: Update the failing issue data in Jira. The text with separators and empty spaces like “ 3,055,071 “ does not match the numeric value 3055071.
-
A solution for the example: First, act upon the error and reset authorization for data imports to resume data imports. Then check on the warnings and update the failing issue data in Jira.
1.3. Validate import options
Validate import options and ensure that no limiting factors prevent the expected data import.
- The authorized user has access to the required data.
- The correct projects are selected.
- The right custom field is selected.
- Is there a JQL query filter in Advanced import options, and if so, are there any criteria that might limit the data of interest?
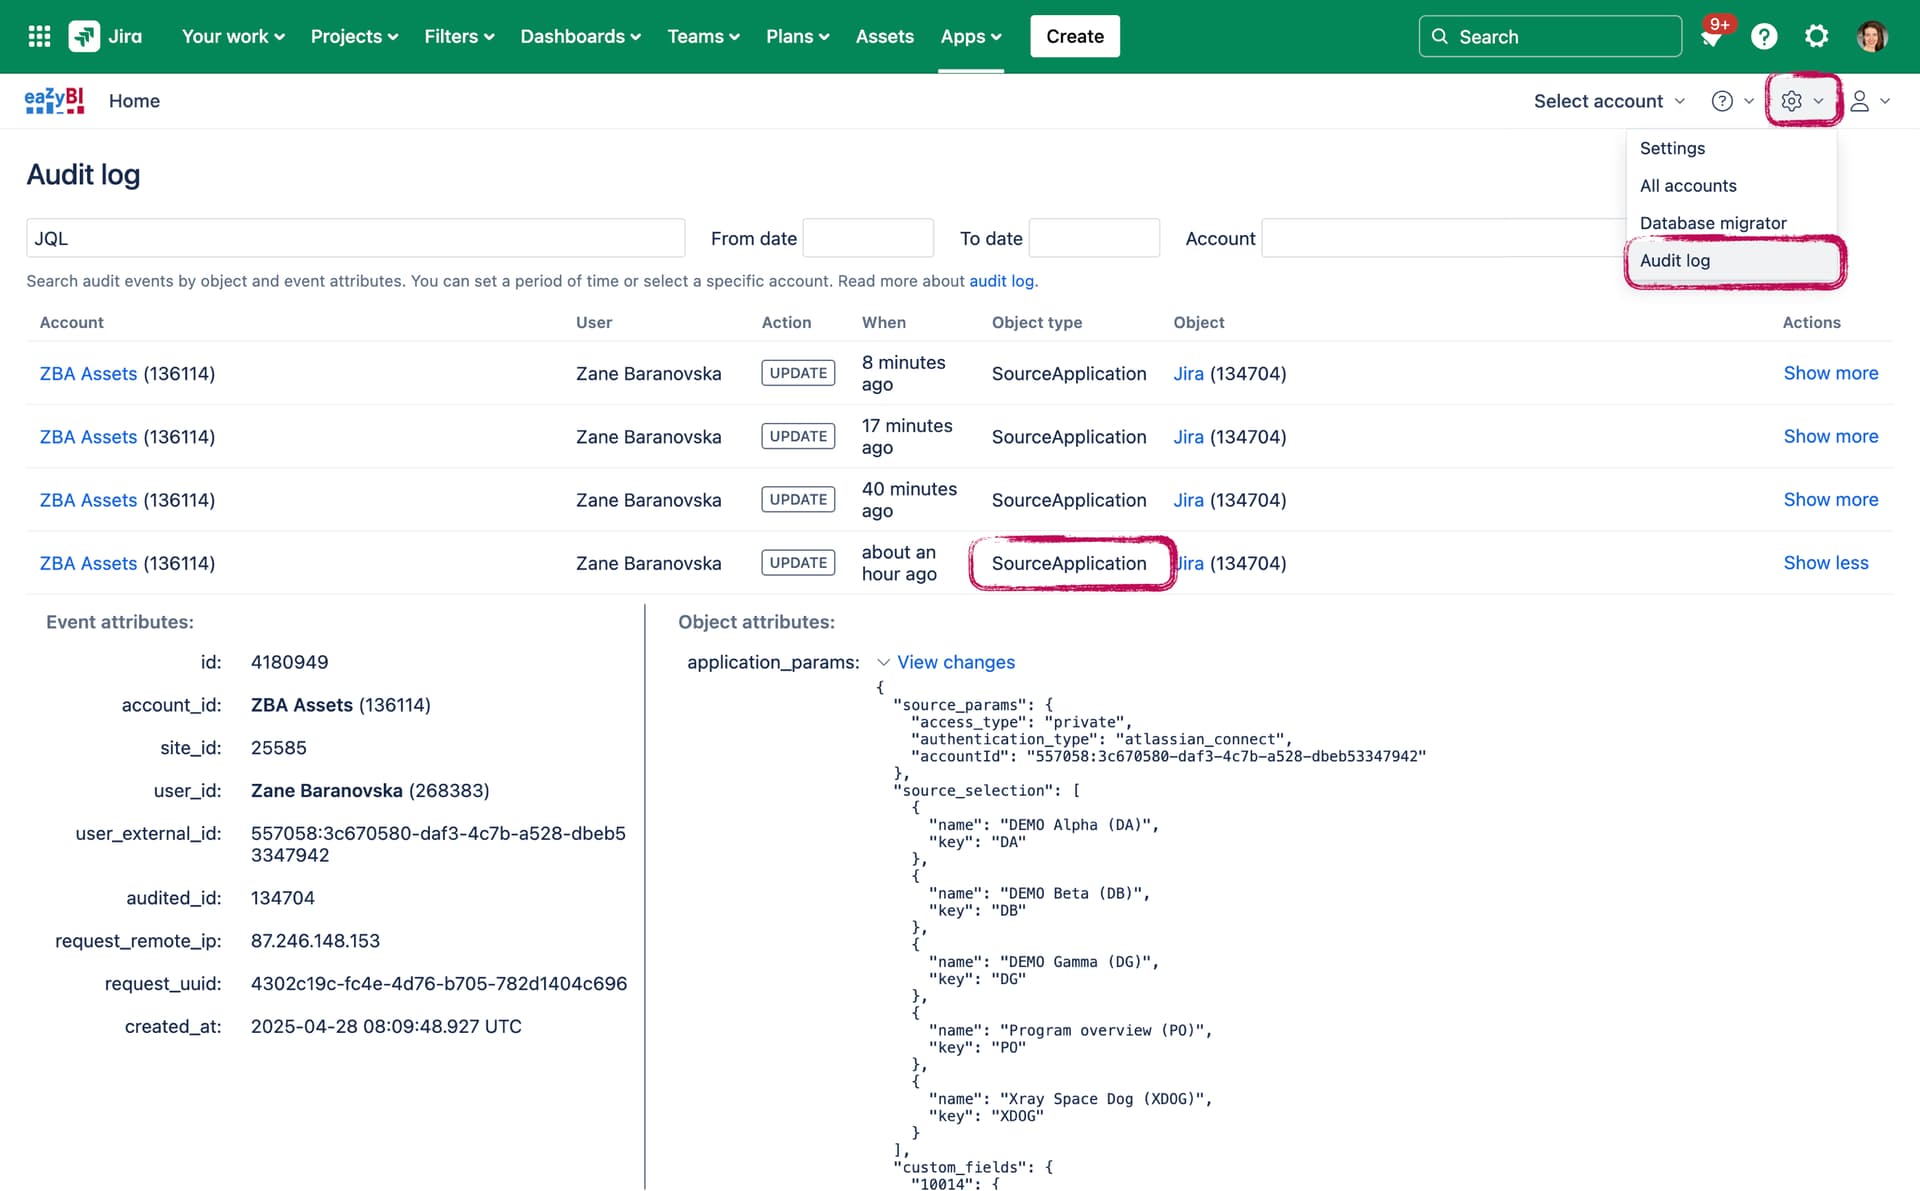
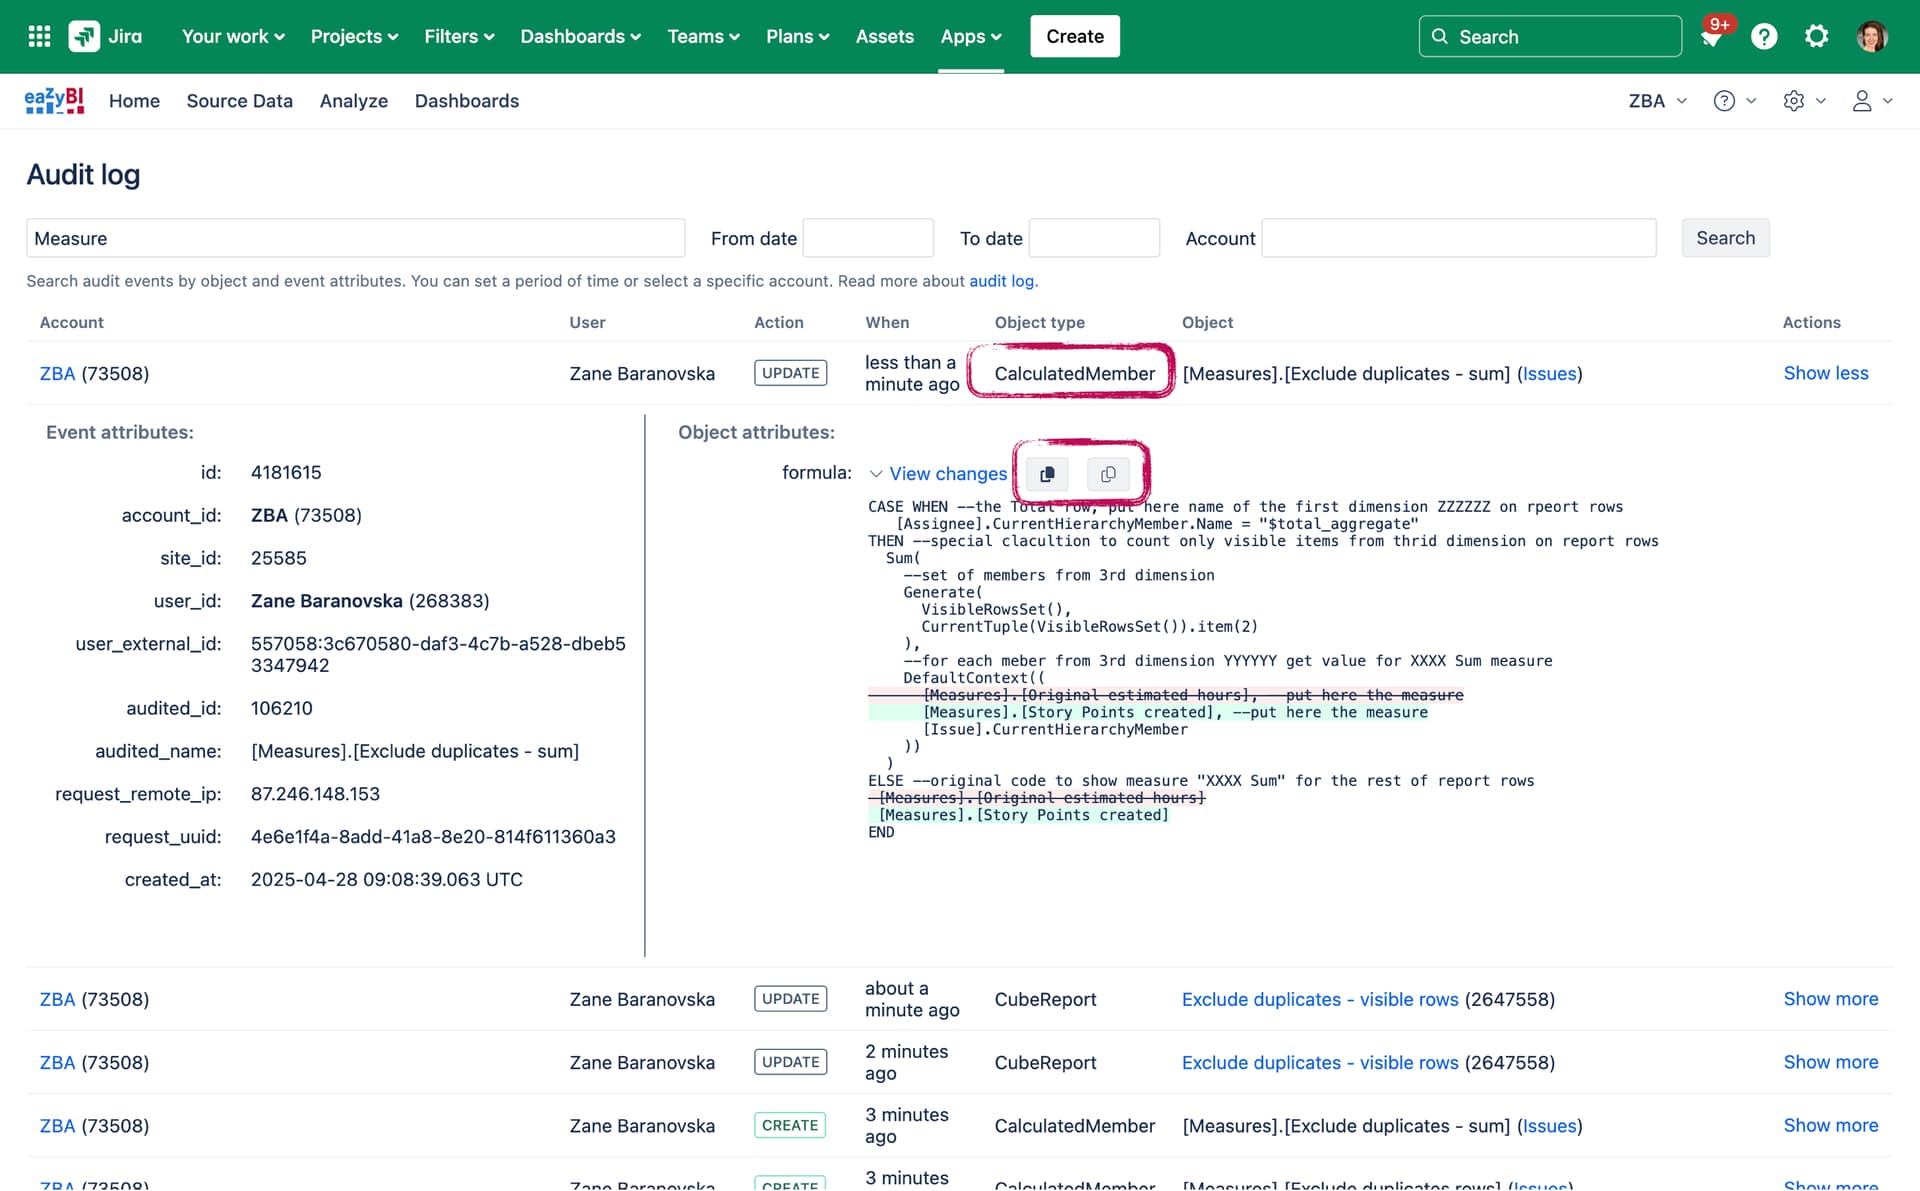
1.4. Check the audit log for changes
“We didn’t change anything, but the report is not working as it did a week ago. ¯\_(ツ)_/¯ "
Usually, behind “nothing changed” are changes made by another user or changes made in another place. For example, editing calcauted measure in one report, other reports sharing the same measure are affected too.
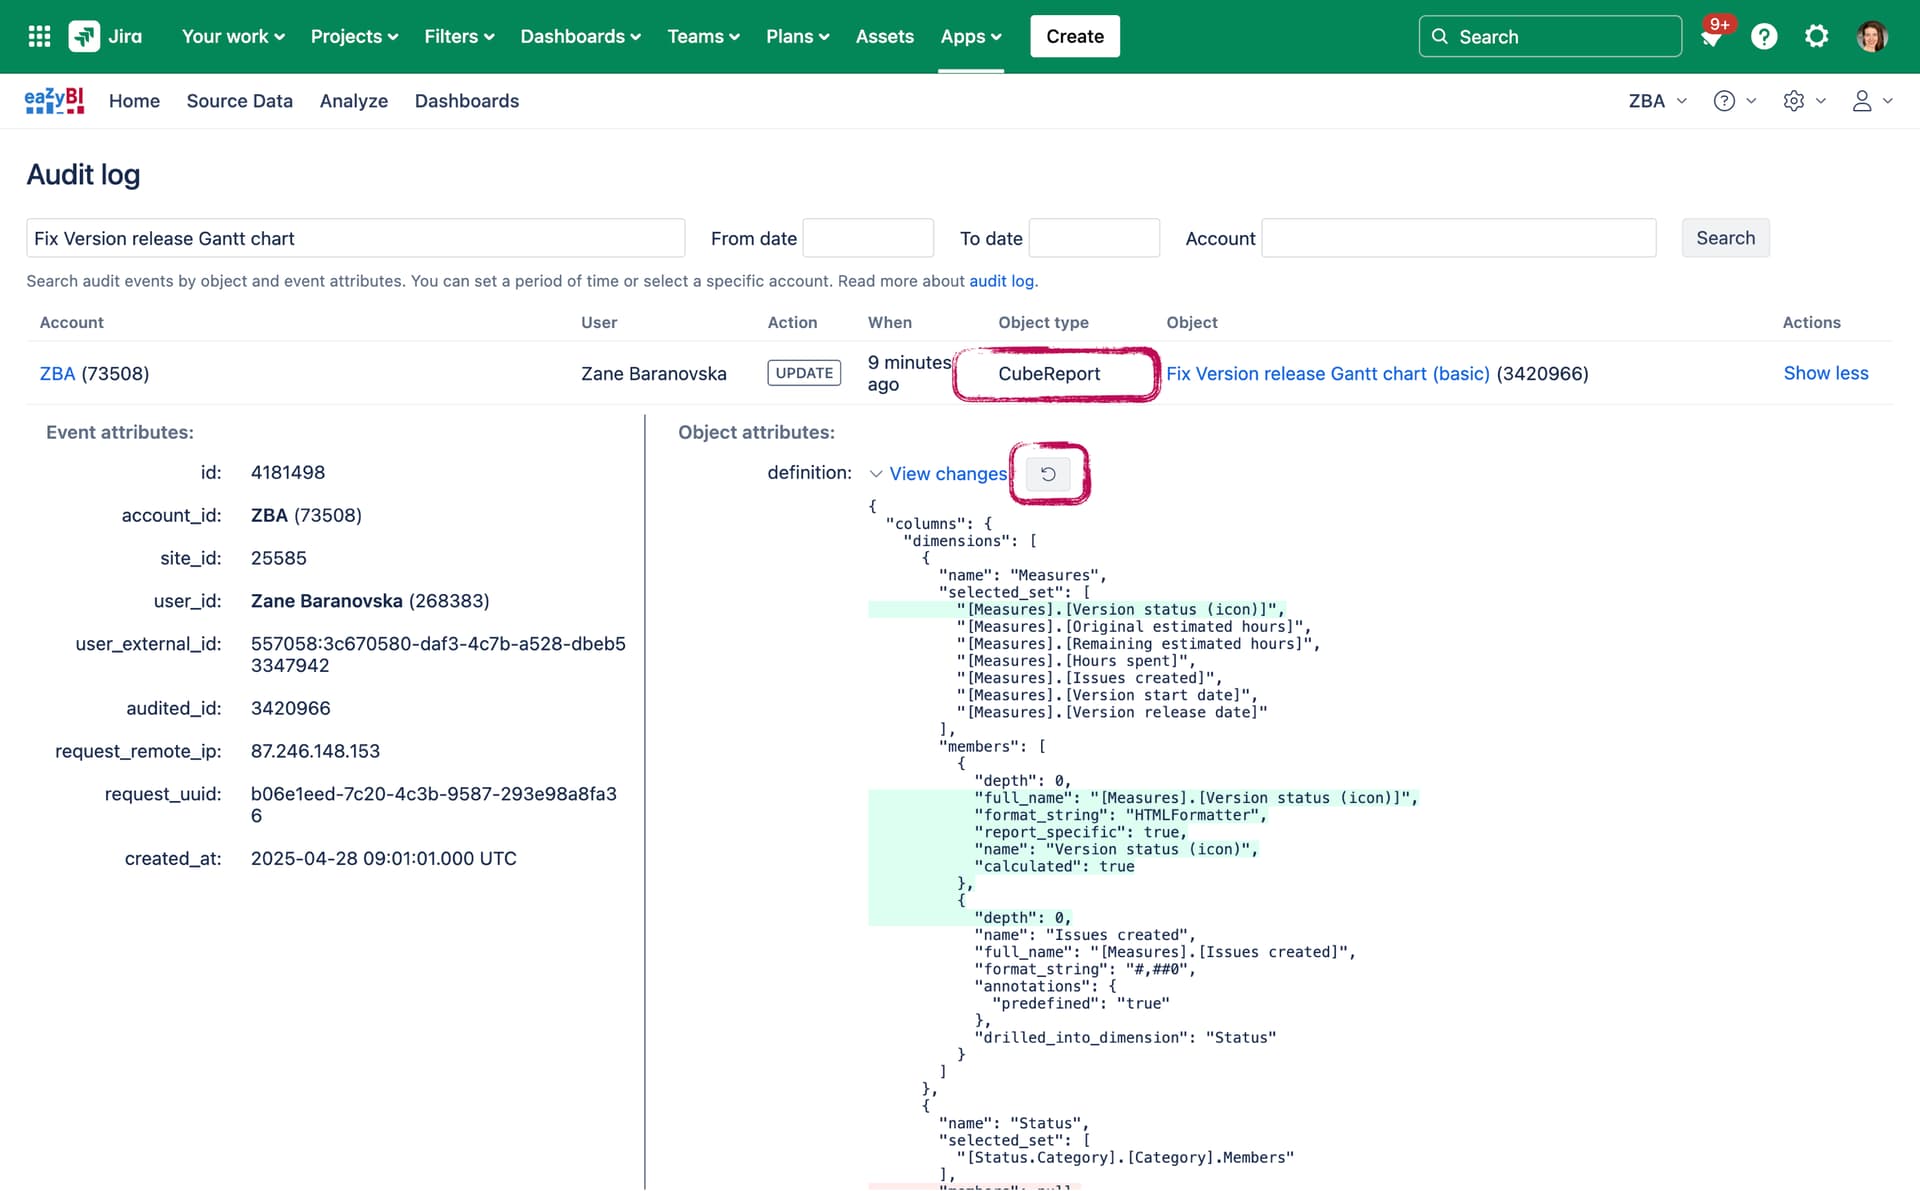
eazyBI stores changes in import options, reports, dashboards, and calculations for the last 30 days. eazyBI admins can access the audit log, see the changes, and even restore to the previous version, or report or copy the previous version of calculations.
-
Changes in import options
-
Change in reports & dashboards
-
Change in calculated measures
2. Is this the right measure and dimension for the job?
Measure is the treasure! Picking the right measure and dimension combination is half the way to a nice chart.
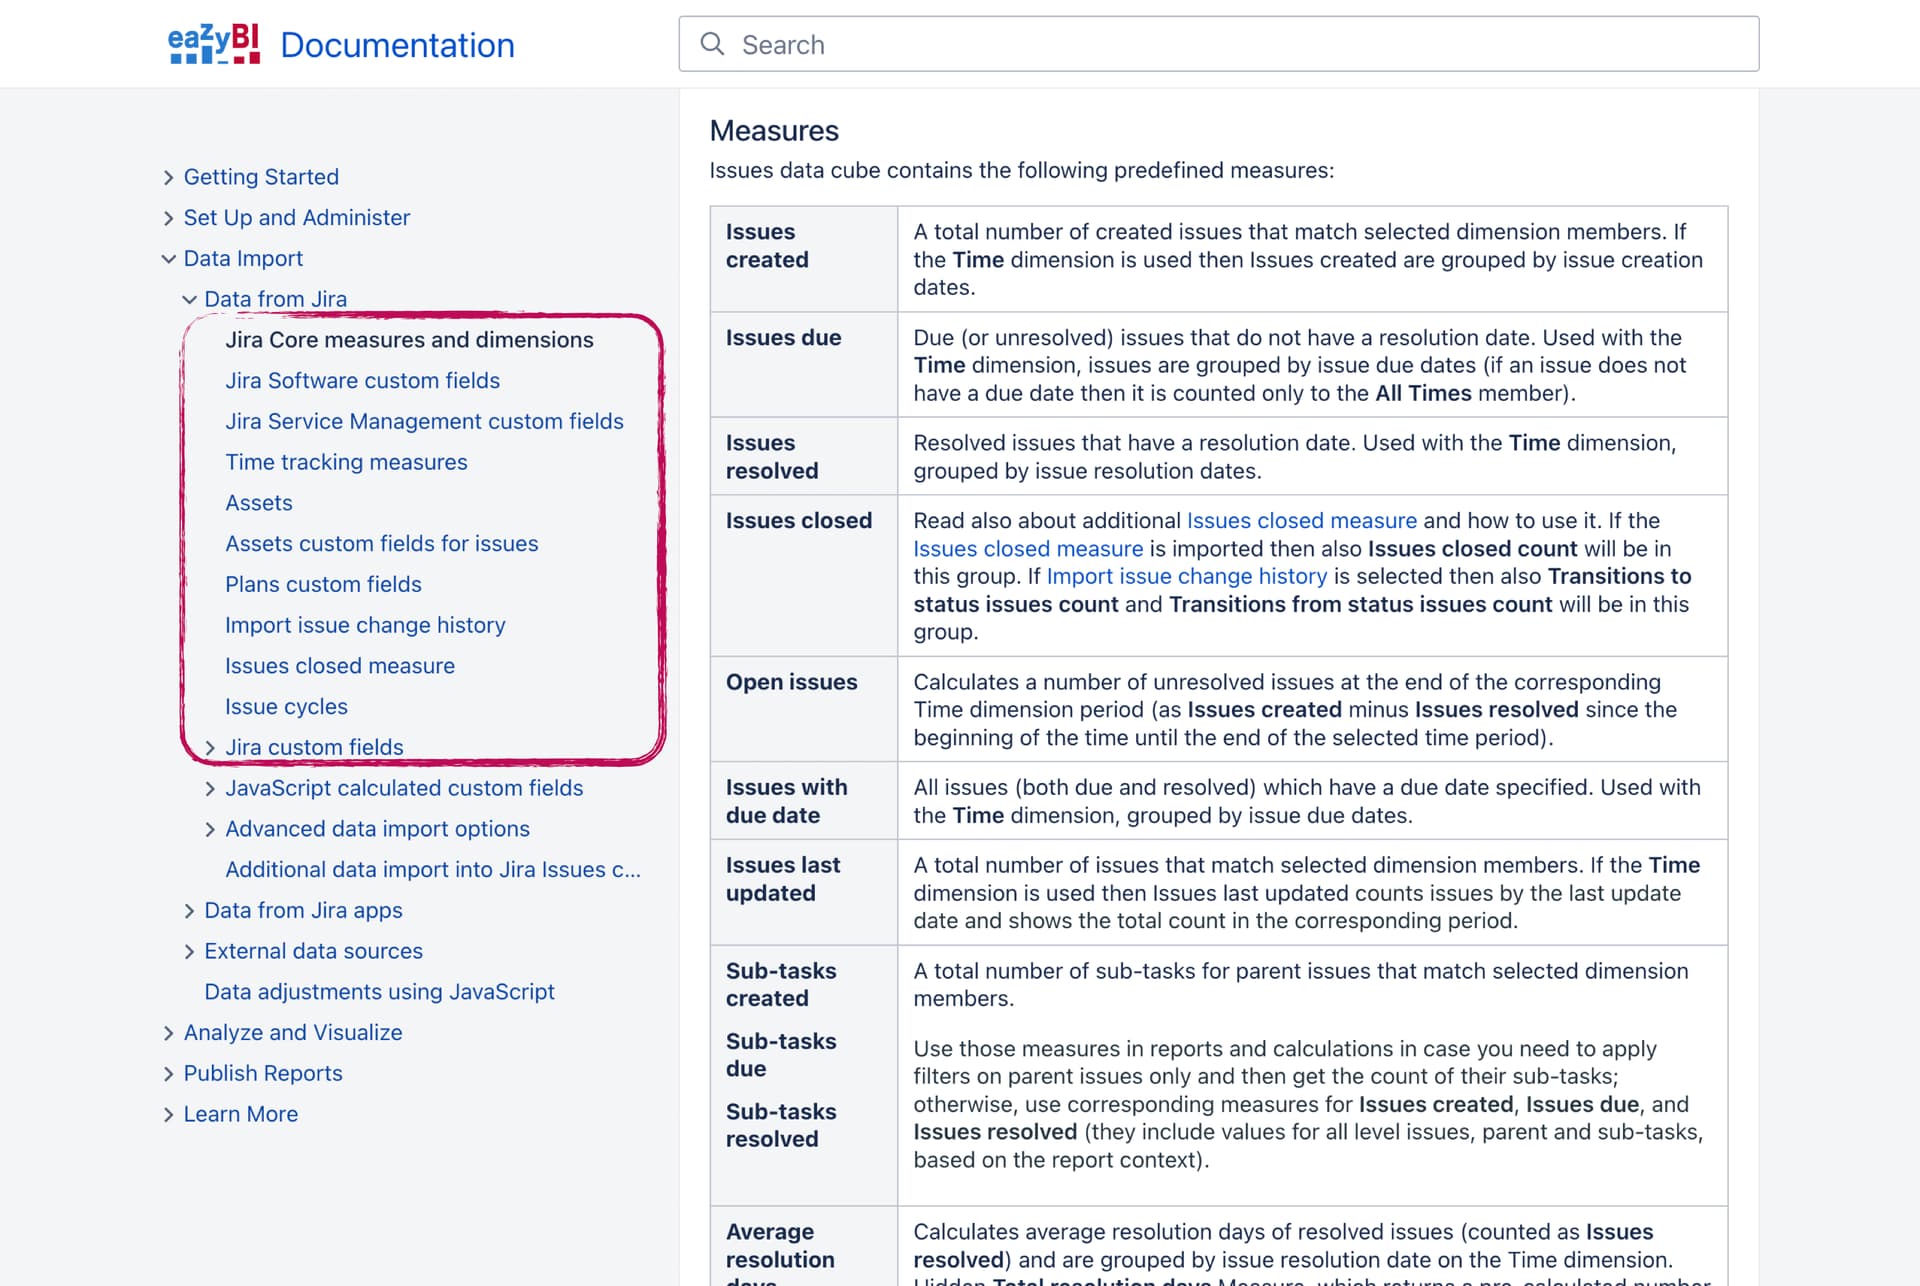
Predefined measures’ names have a pattern and contain much information:
- Measure (respond to report context) or property (descriptive information)
- What is counted
- How it behaves with the Time dimension
When in doubt, read the eazyBI documentation explaining the predefined measures and dimensions: Data Import.
3. #NoFilters
Filters shape the data you see in the report, and there are several ways to do this:
3.1. Check if the report has any conflicting filters
Remove filters one by one to see which of them might affect the report outcome differently than expected–hide some rows or include more than needed.
- Check the values selected on page filters (e.g., Project, Time, Statuses) and validate if data appears when these values are set to defaults like “All Projects”. If there is any change, these criteria should probably be reviewed and changed.
- Check if the report has any row filters or selections to show only top/bottom rows, limiting the data display. Remove the filters one by one to see how they change the outcome. If there is any change, these criteria should probably be reviewed and changed.
- Switch the Nonempty options on/off to see how it affects the result. For example, the Nonempty for time projection would hide relevant periods, and therefore it should be off.
![]()
![]() Here are several examples illustrating some of the common mistakes in report filters. Open those reports and see for yourself what is wrong:
Here are several examples illustrating some of the common mistakes in report filters. Open those reports and see for yourself what is wrong:
- Page filter & Measure combination
Sprint velocity chart - filter by Time - Issues - eazyBI Demo Training - eazyBI - Conflicting hierarchies of the same dimension
Time hierarchy do not match - Issues - eazyBI Demo Training - eazyBI - Conflicting page filters
Estimated and logged hours in version - Issues - eazyBI Demo Training - eazyBI - Filter rows by measure or property
Story points progress and velocity by sprints in epic - Issues - eazyBI Demo Training - eazyBI - Nonempty - hidden rows
Time Tracking Burndown in Selected Version - Issues - eazyBI Demo Training - eazyBI - Nonempty - no response to page filters, too many rows
List of issues in progress - Issues - eazyBI Demo Training - eazyBI
3.2. See data on an individual issue without any filters
Another approach, you can troubleshoot data starting with the blank report and gradually adding measures and dimensions to see how the data is grouped for a single item. In this case, validate qualitatively on a single item, like one Issue. We are humans, and it is much easier to follow all the details of one item than 10. Also, this approach requires very detailed data at a level that might affect report performance.
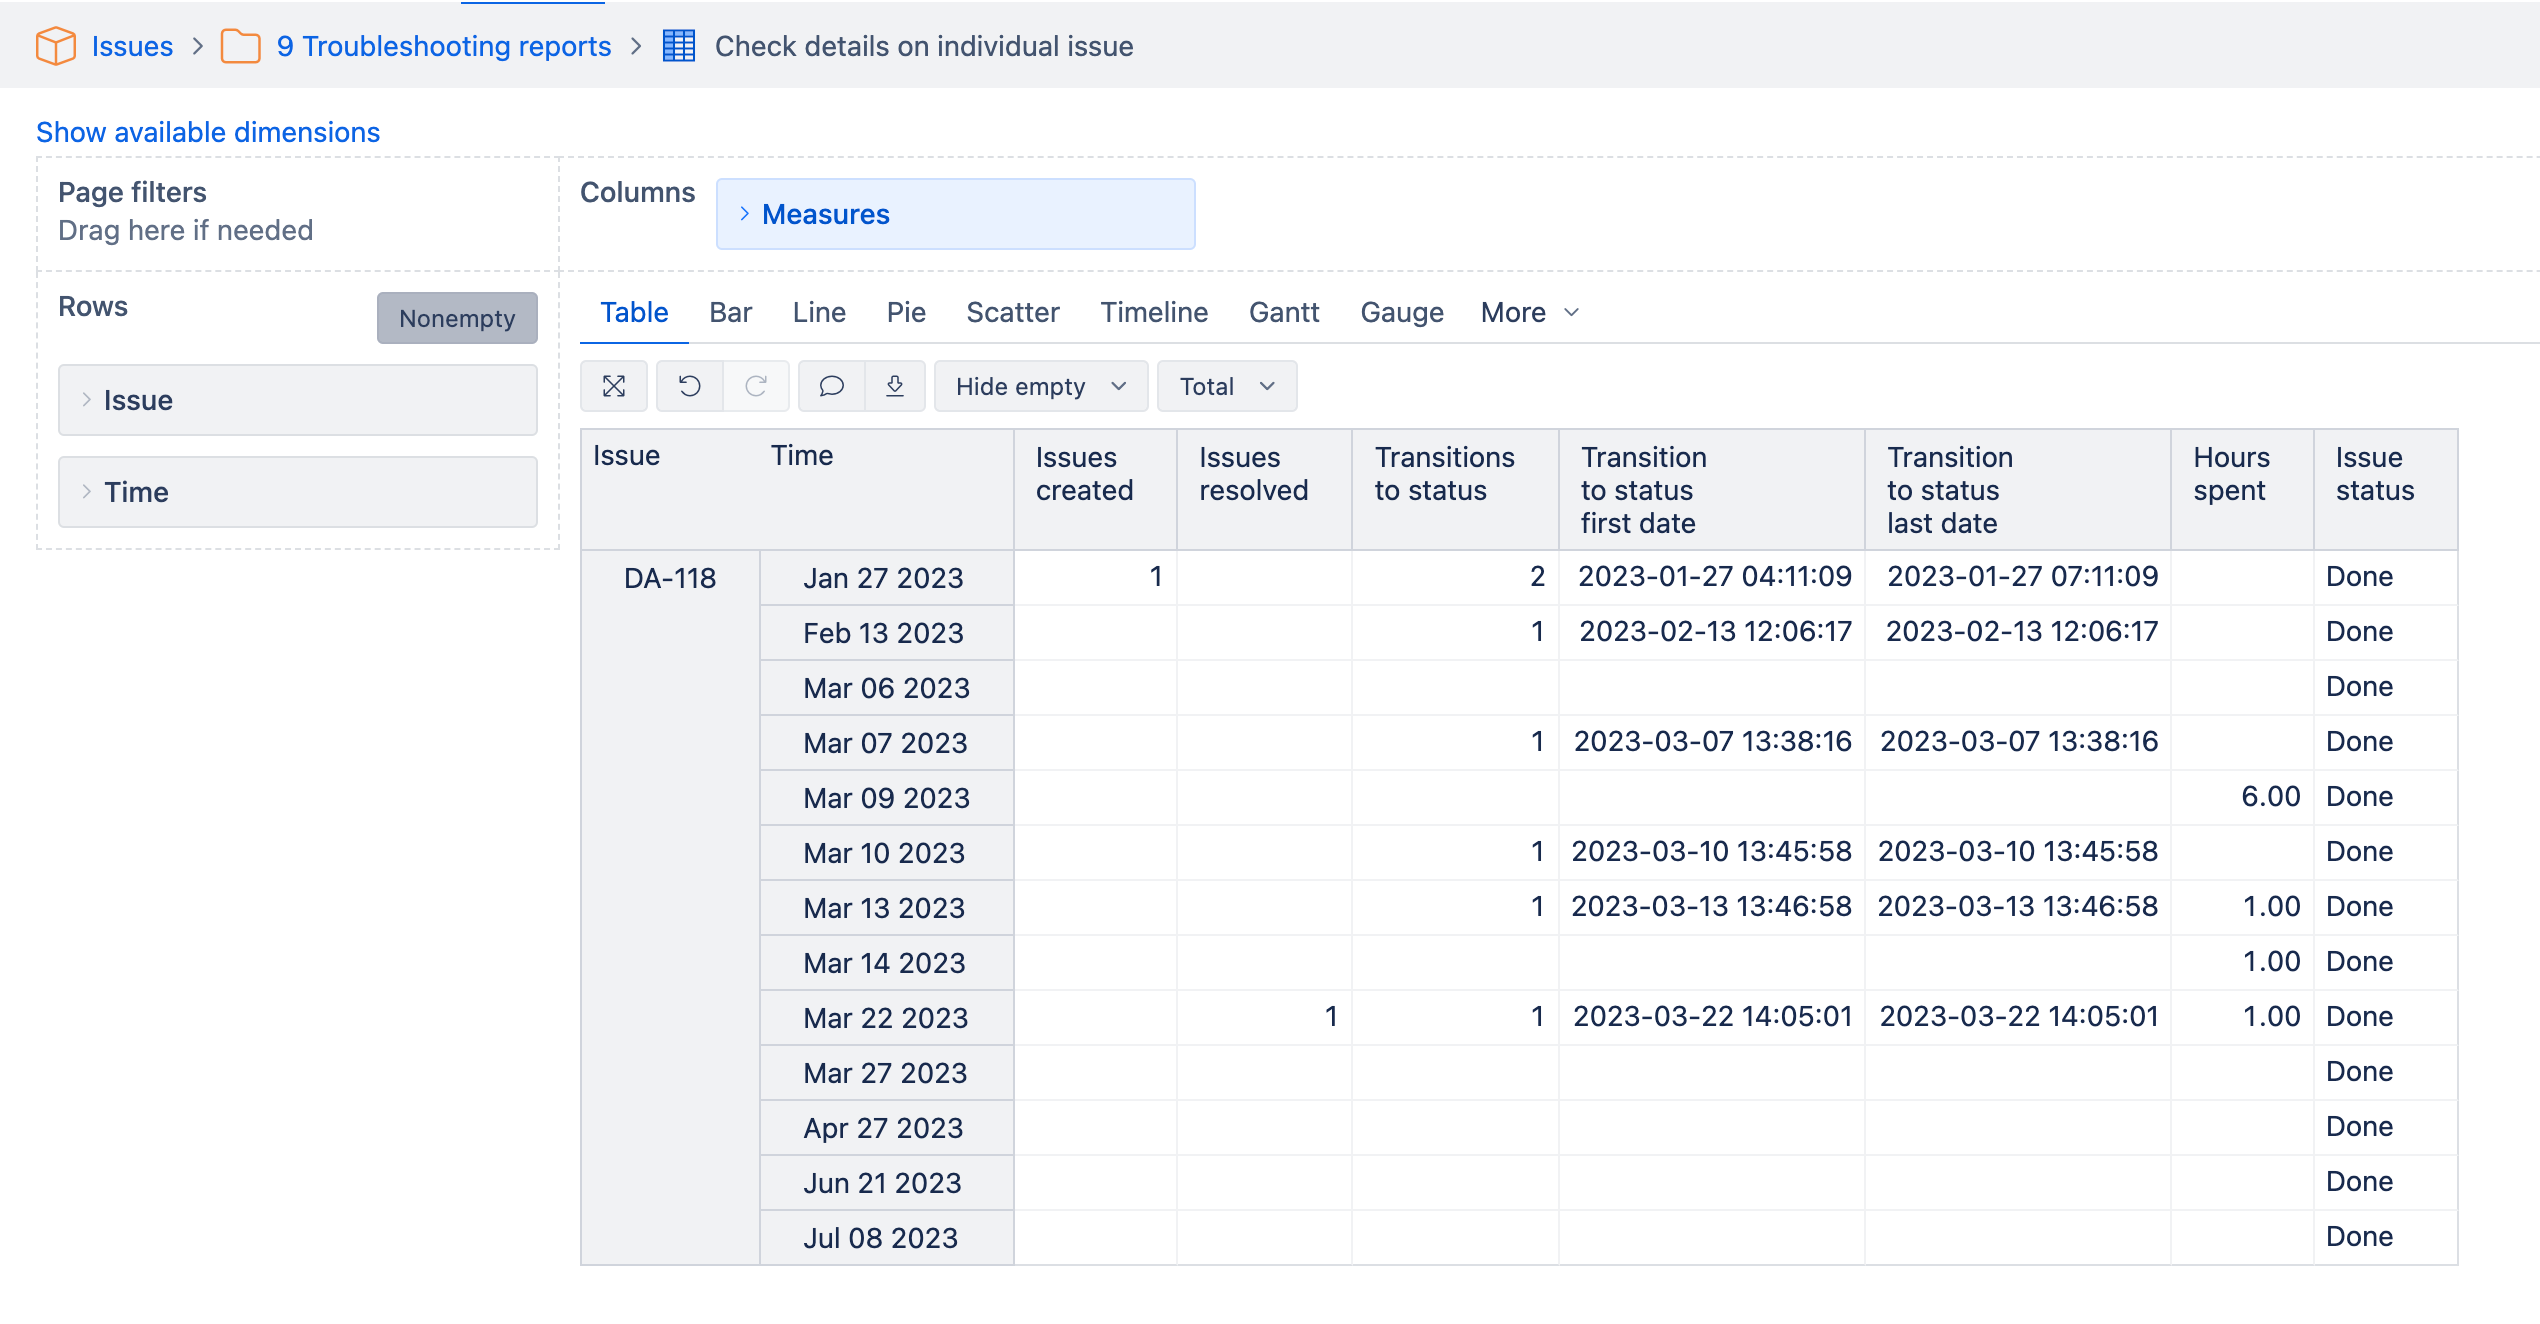
Here is an example of how to troubleshoot the change history of a single issue.
- Choose one issue you would expect to see in the report.
- Search and bookmark a single issue in the Issue dimension.
- Use predefined measures and properties on columns. measures would respond to the dates on rows, while properties would show values for any row
- Time dimension is at the Day level in rows.
If you troubleshoot other information about the item, such as Sprint changes, use the Sprint dimension or rows and select the lowest hierarchy level. - #NoFilters. Do not set any dimension as a page filter. You can add another dimension to the report rows to see how the data is split for this particular issue.
- Calculated measure with function AllProperties to check on all item (issue) properties available in eazyBI.
[Issue].CurrentMember.AllProperties
![]()
![]() Exercise: check individual issue data. The example below is from the eazyBI Demo Training account for issue key DA-118.
Exercise: check individual issue data. The example below is from the eazyBI Demo Training account for issue key DA-118.
4. Debug the calculated measure
- Video “MDX debugging: How to see through calculated measure” Videos: calculations with MDX
- Video “Hidden Gems of MDX”Videos: calculations with MDX

 Play the game
Play and learn in the Kahoot!