Hello all,
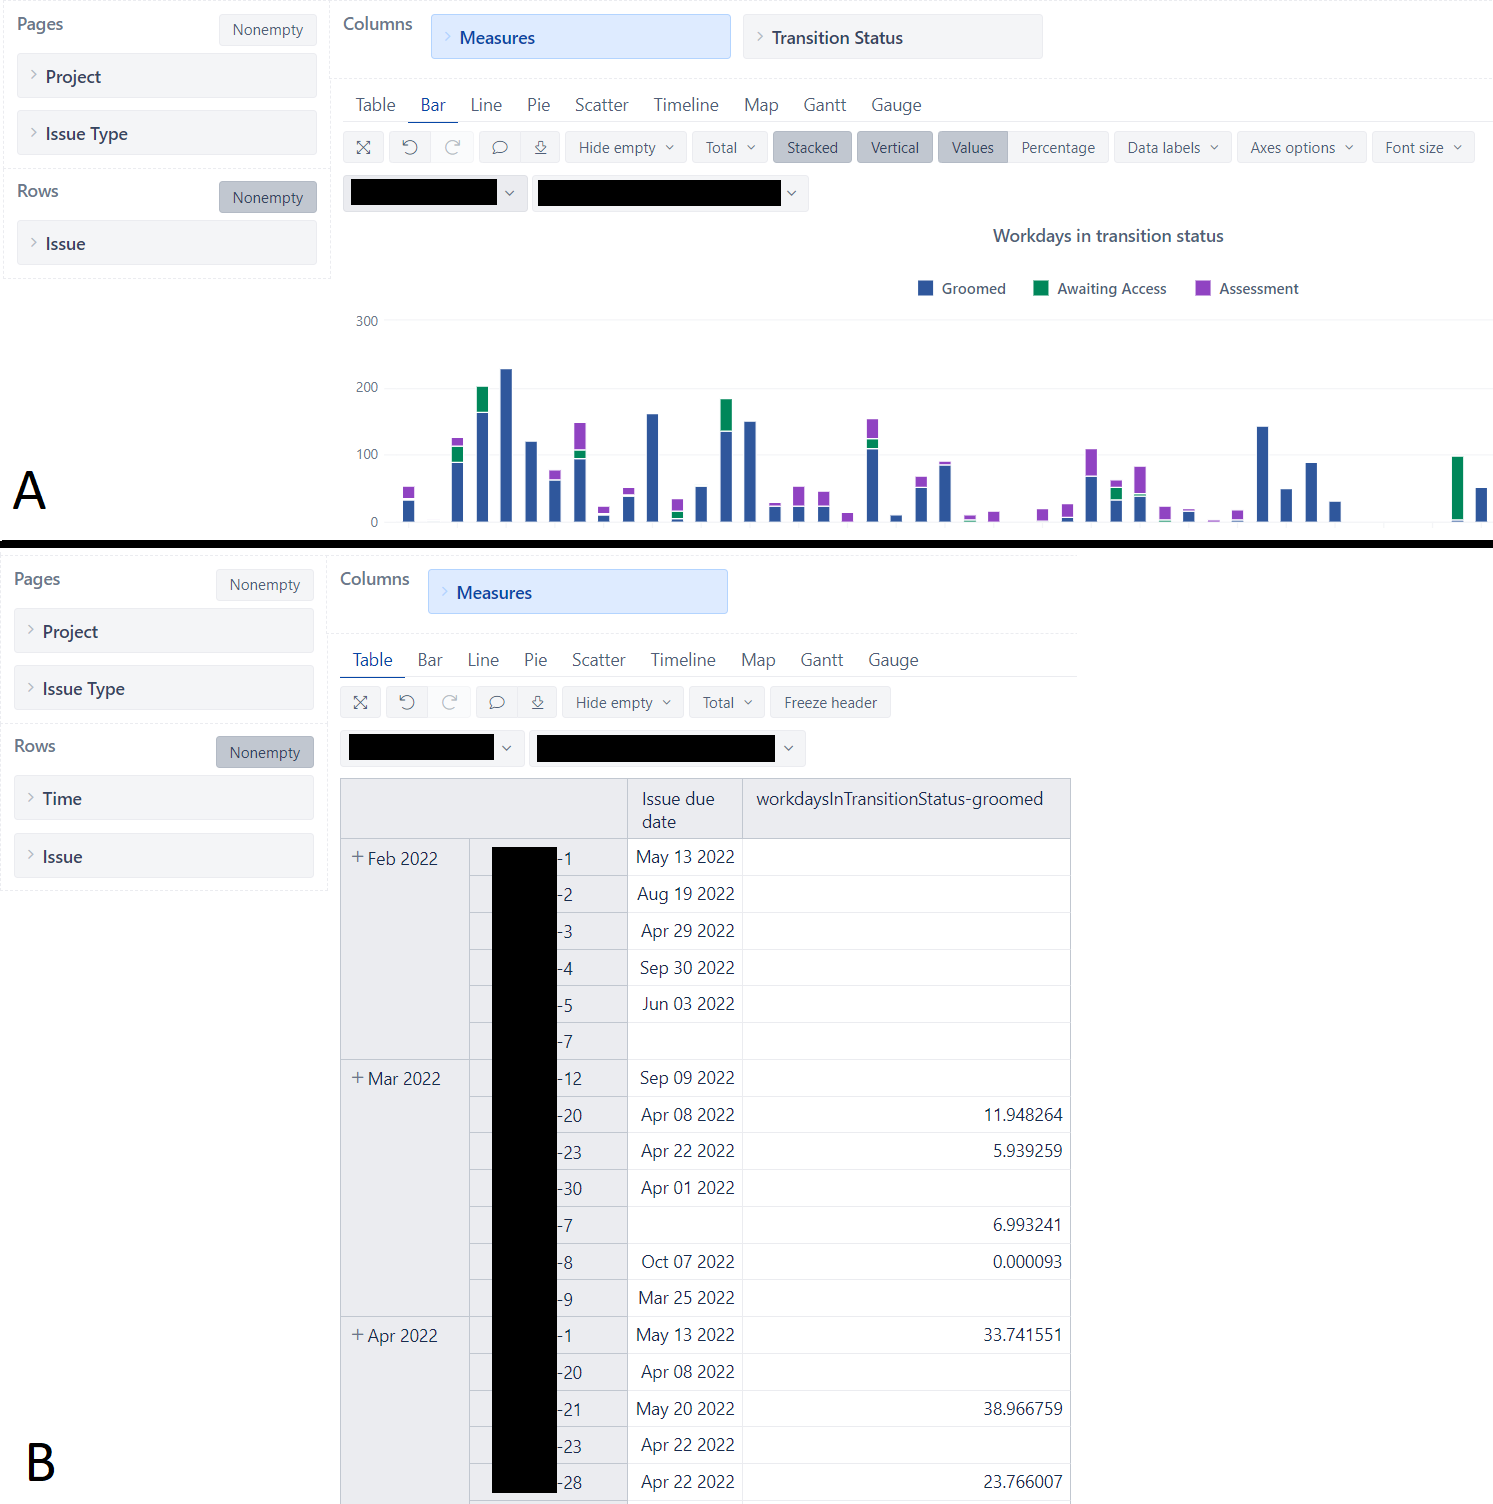
I’m looking to create a bar chart of issues and how long they have spent in a set of transition statuses, similar to A, where each issue has a single bar:
However, I’m looking to have these issues ordered by their due date, and correctly fall under each month based on this field.
For example, with the data in the above image (B), I would want XXXX-1 to be listed under the May , and XXXX-2 under August, and so on.
workdaysInTransitionStatus-groomed is calculated as the following:
Sum(
  {[Transition Status].[Groomed]},
  [Measures].[Workdays in transition status]
)
I am unsure of how to override “Workdays in transition status” controlling where an issue is placed in Time. Is it reasonable to do what I am looking for?
Thank you in advance!
@IanGuile
Try these steps.
- switch to table view and temporarily remove the “Transition status” dimension from the report.
- select the measure “issues with due date” from the “Measures” in report columns
- click on the column “Issues with due date” and select to filter rows by this column with “>” greater than filter and type integer 0.
Create reports
- After that, it is safe to click on the column “Issues with due date” and remove it from the report. Filter conditions should be visible in the toolbar now.
- Add “Transition Status” back to report columns.
- create new calculated measure to let eazyBI ignore the “Time” filter for the Workdays calculation.
(
[Transition Status].[Groomed],
[Time].Currenthierarchy.DefaultMember,
[Measures].[Workdays in transition status]
)
That code will calculate the total time in status Groomed for each issue regardless when the issue have due date.
Martins / eazyBI
Thank you! This was exactly what I was looking for.