Hi,
I have question about different average.
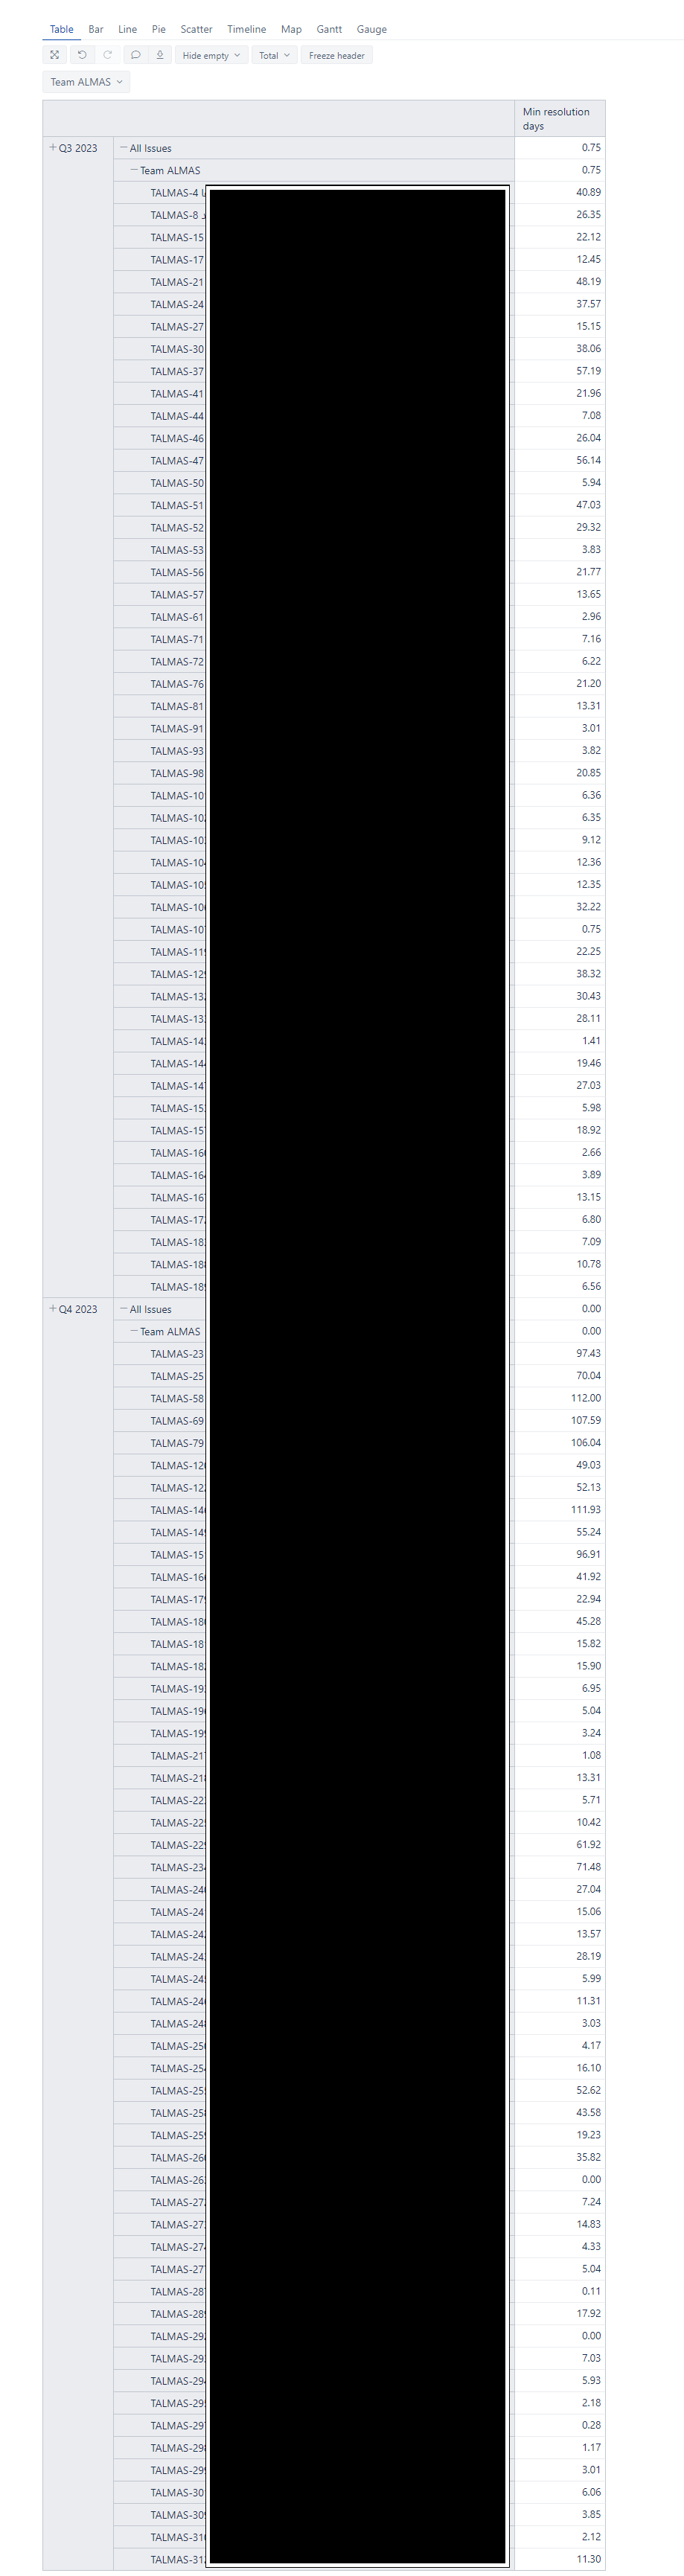
My question is, how to calculate the average for each quarter for the “Min resolution days” index, which is the first column of my data in the table?
kind regard,
Hi,
I have question about different average.
My question is, how to calculate the average for each quarter for the “Min resolution days” index, which is the first column of my data in the table?
kind regard,
Hi mojtaba_farsian,
Thank you for reaching out to eazyBI community!
Could you give us the formula for “Min resolution days” used in your report? Without seeing it, my best guess would be that you can create a similar formula by using the function Avg() instead of Min().
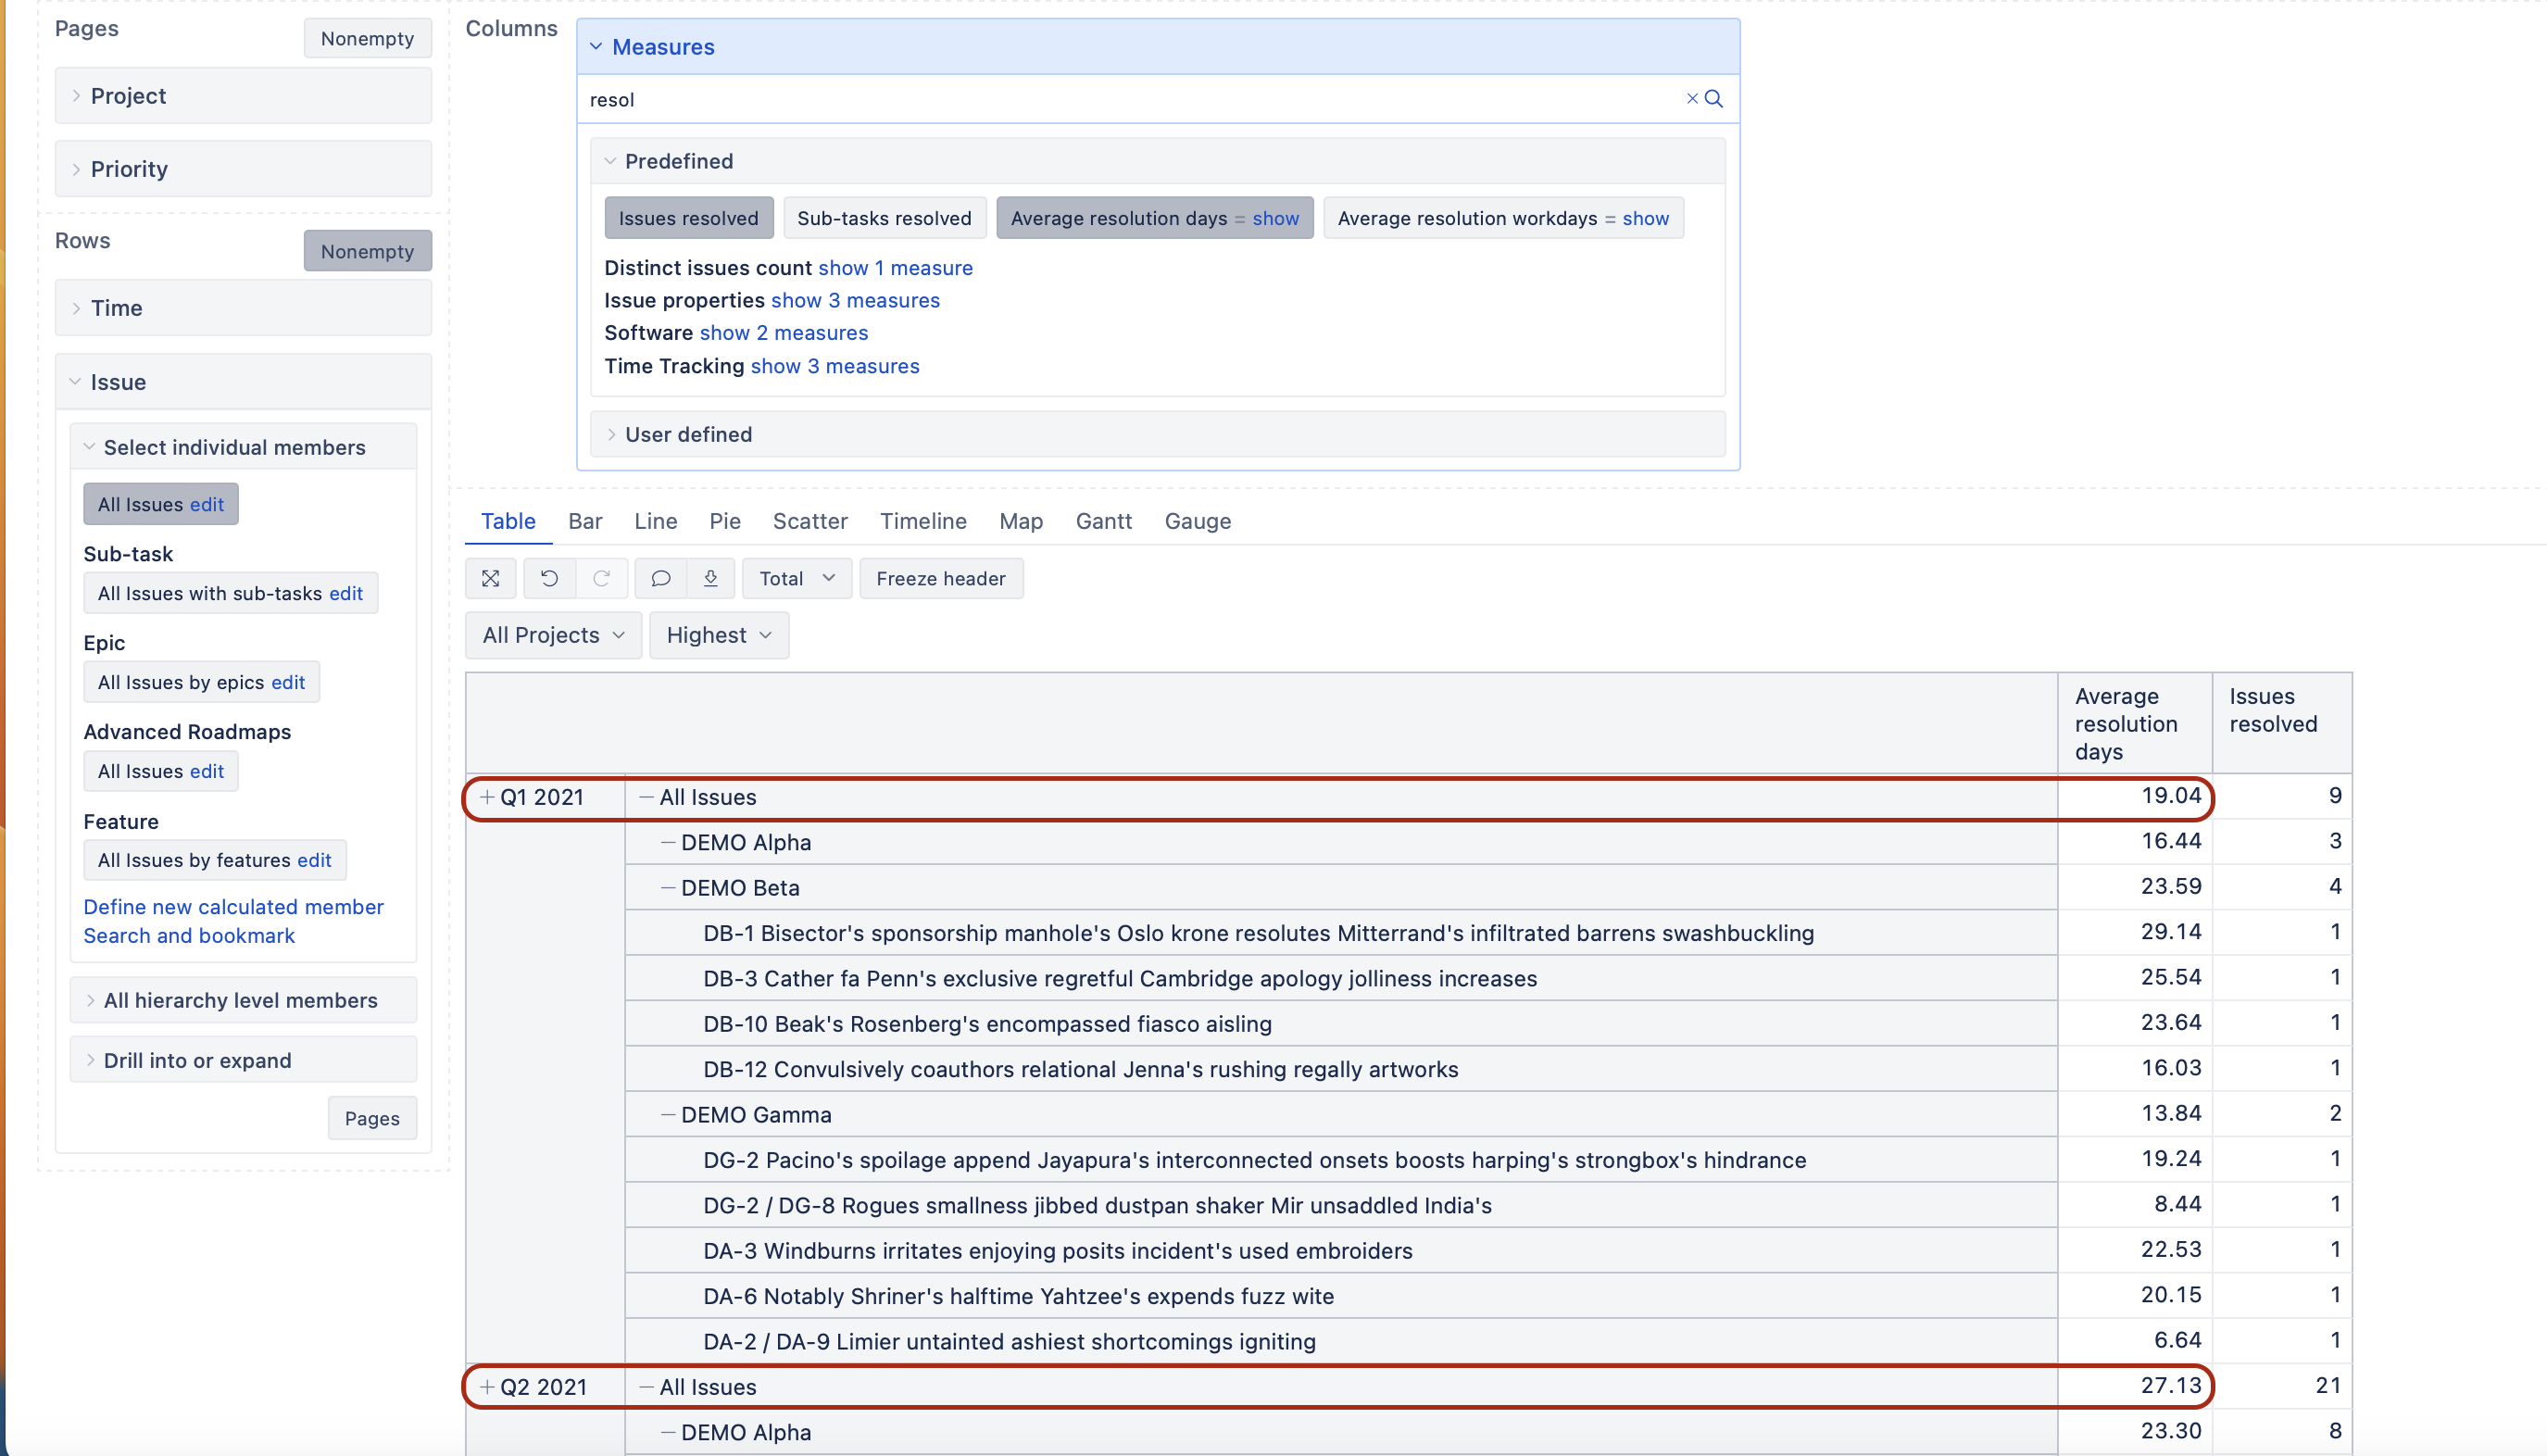
Also, eazyBI has predefined “Average resolution days” that will show resolution days for issue-level and calculate average resolution days for all other levels of aggregation.
For example, in this report “All issues” will show average resolution days in each quarter for the highest priority (page filter) issues and in all projects. Each project will have separate average.
Let us know if you have more questions!
Kindly,
Ilze