Utilizing the following measure (_foo) to test the splitting of Story Points in issues with multiple components:
CASE WHEN
--one or more issue components exist
  CACHE(
    Count(
      Filter(
        [Project].[Component].GetMembersByKeys(
        [Issue].CurrentHierarchyMember.Get('Component IDs')),
        [Measures].[Story Points resolved] > 0
      )
    )
  ) > 0
THEN
  CASE WHEN
  --multiple or all components selected on page filter
    ([Project].Level.Name = "(All)"
    OR
    [Project].Level.Name = "Project")
      AND
      [Measures].[Story Points resolved] > 0
  THEN
  --hours spent when ignoring components
    ([Project].DefaultMember,
    [Measures].[Story Points resolved])
    /
--divide by the number of applicable components
   Count(
     Filter(
        [Project].[Component].GetMembersByKeys(
        [Issue].CurrentHierarchyMember.Get('Component IDs')),
        ([Measures].[Story Points resolved]) > 0))
   *
  --multiply by the number of components selected
   Count(
     Filter(
       DescendantsSet([Project].CurrentHierarchyMember, [Project].[Component]),
       [Measures].[Story Points resolved] > 0
      )
    )
  ELSE
  --split values per each component
  --take the total value regardless of components
    ([Project].DefaultMember,
    [Measures].[Story Points resolved])
    /
  --divide by the number of components applicable
    Count(
      Filter(
        [Project].[Component].GetMembersByKeys(
        [Issue].CurrentHierarchyMember.Get('Component IDs')),
        [Measures].[Story Points resolved] > 0
      )
    )
  END
ELSE
--no issue components exist
  [Measures].[Story Points resolved]
END
The issue selected has a value of three story-points and incorporates two components.
Now note the differing highlighted values on the table and drill-through-issue screenshots:
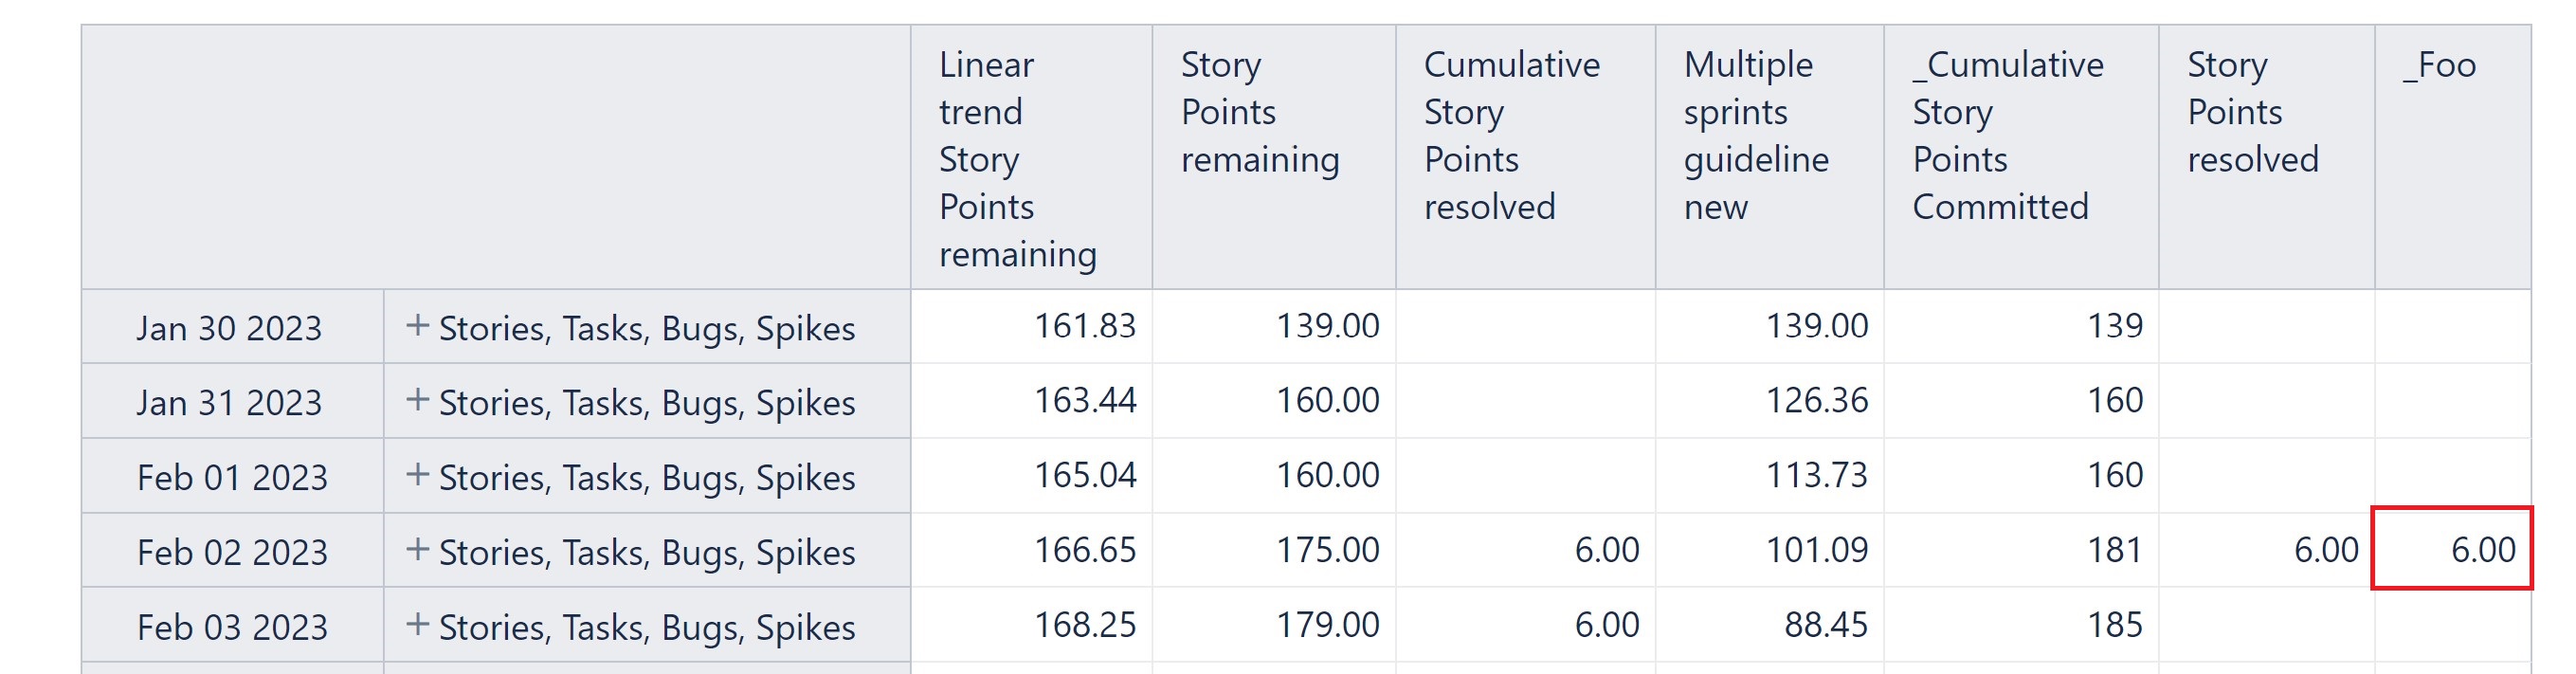
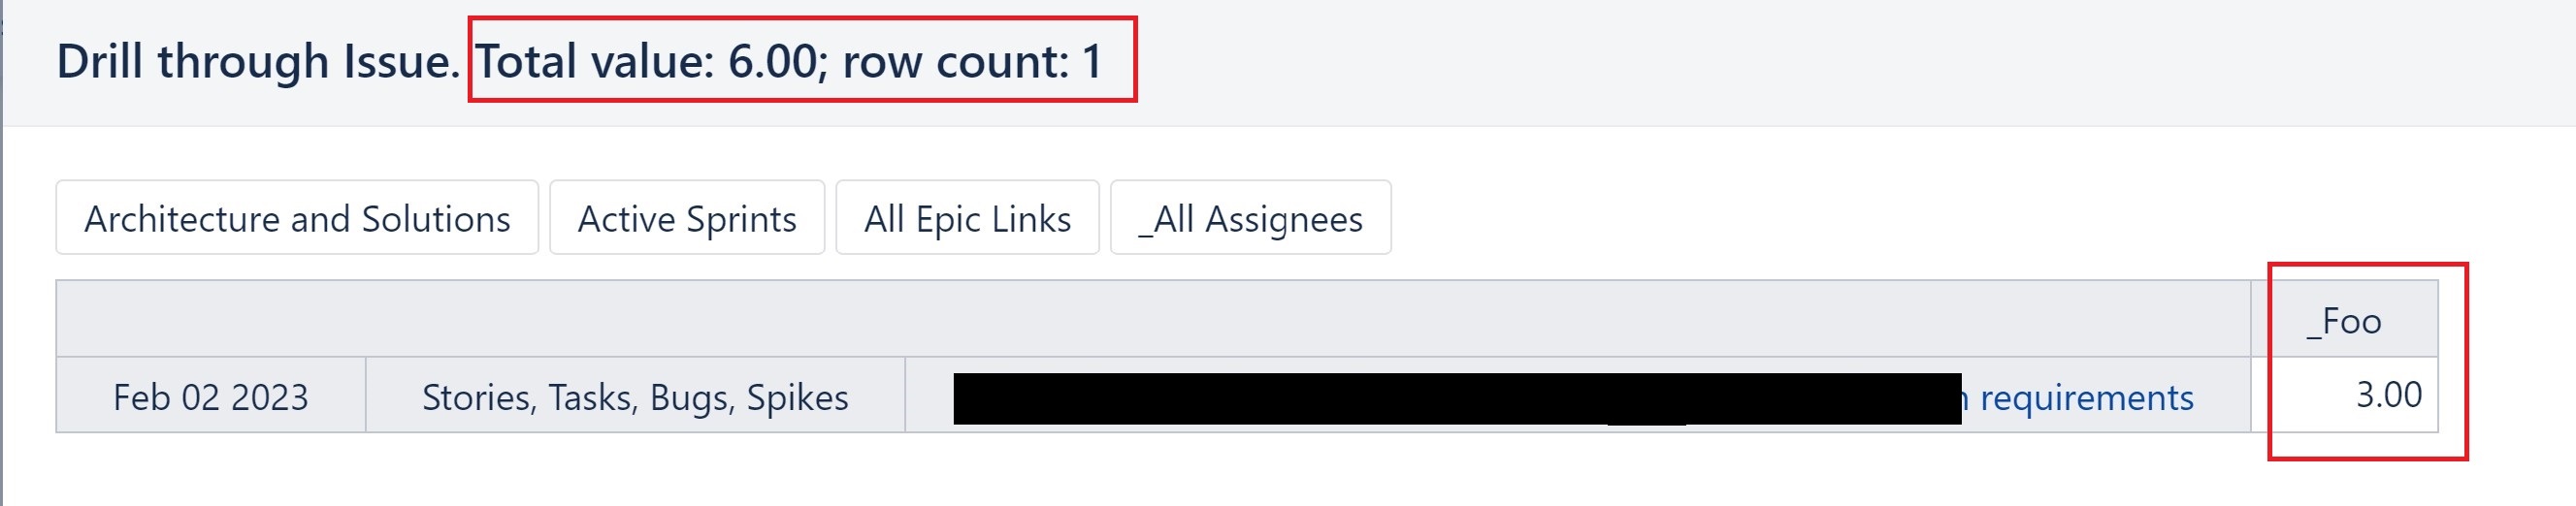
The drill-through-issue value of 3 is the correct value; why does the table depict 6 and the drill-through-issue total-value indicate 6?