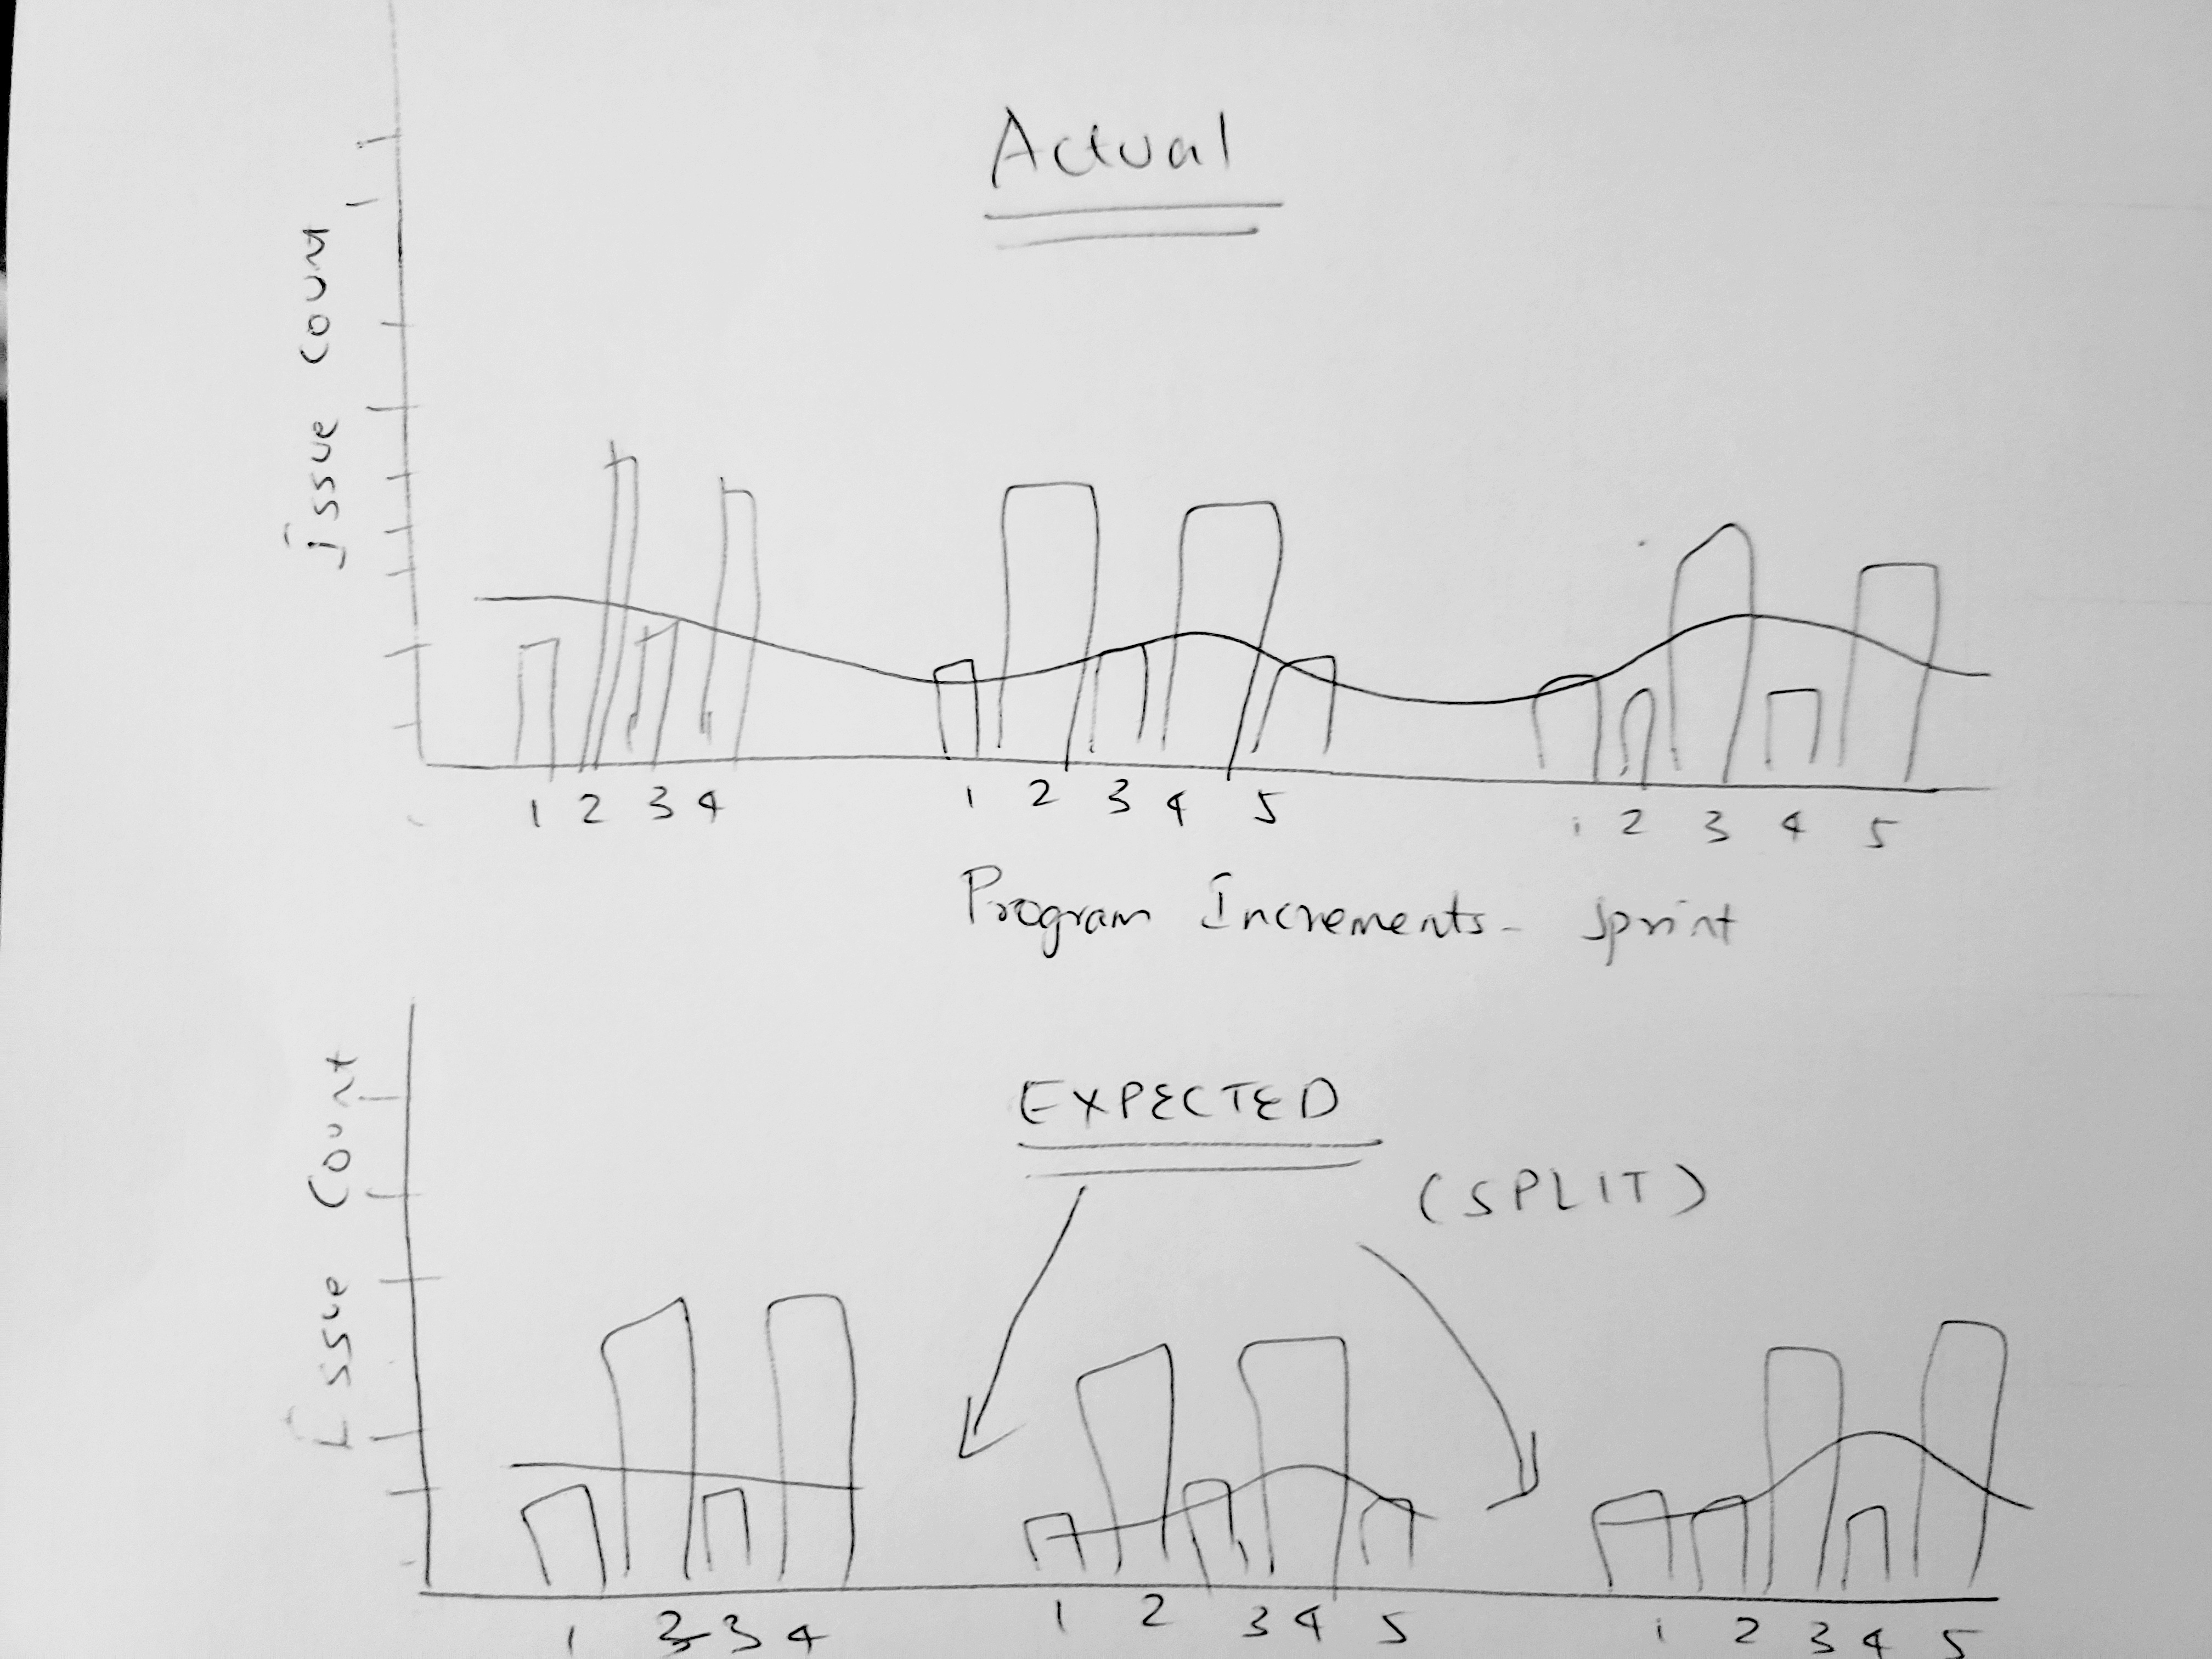
I am trying to split chart by increments. Currently I have a line that runs across the increments, instead I want it to just run separately(split increments) across each increment in the same chart. Can you please help in understanding how I can split the chart by increments.
Hi @Pre,
The Line chart connects two dots that are right next to each other (side by side rows or columns) and can represent continuity. And the line breaks when there is a period without data in between.
If there is no continuity between data, then you might want to show data of a single Program Increment at the time. Set dimension representing Program Increment on report pages.
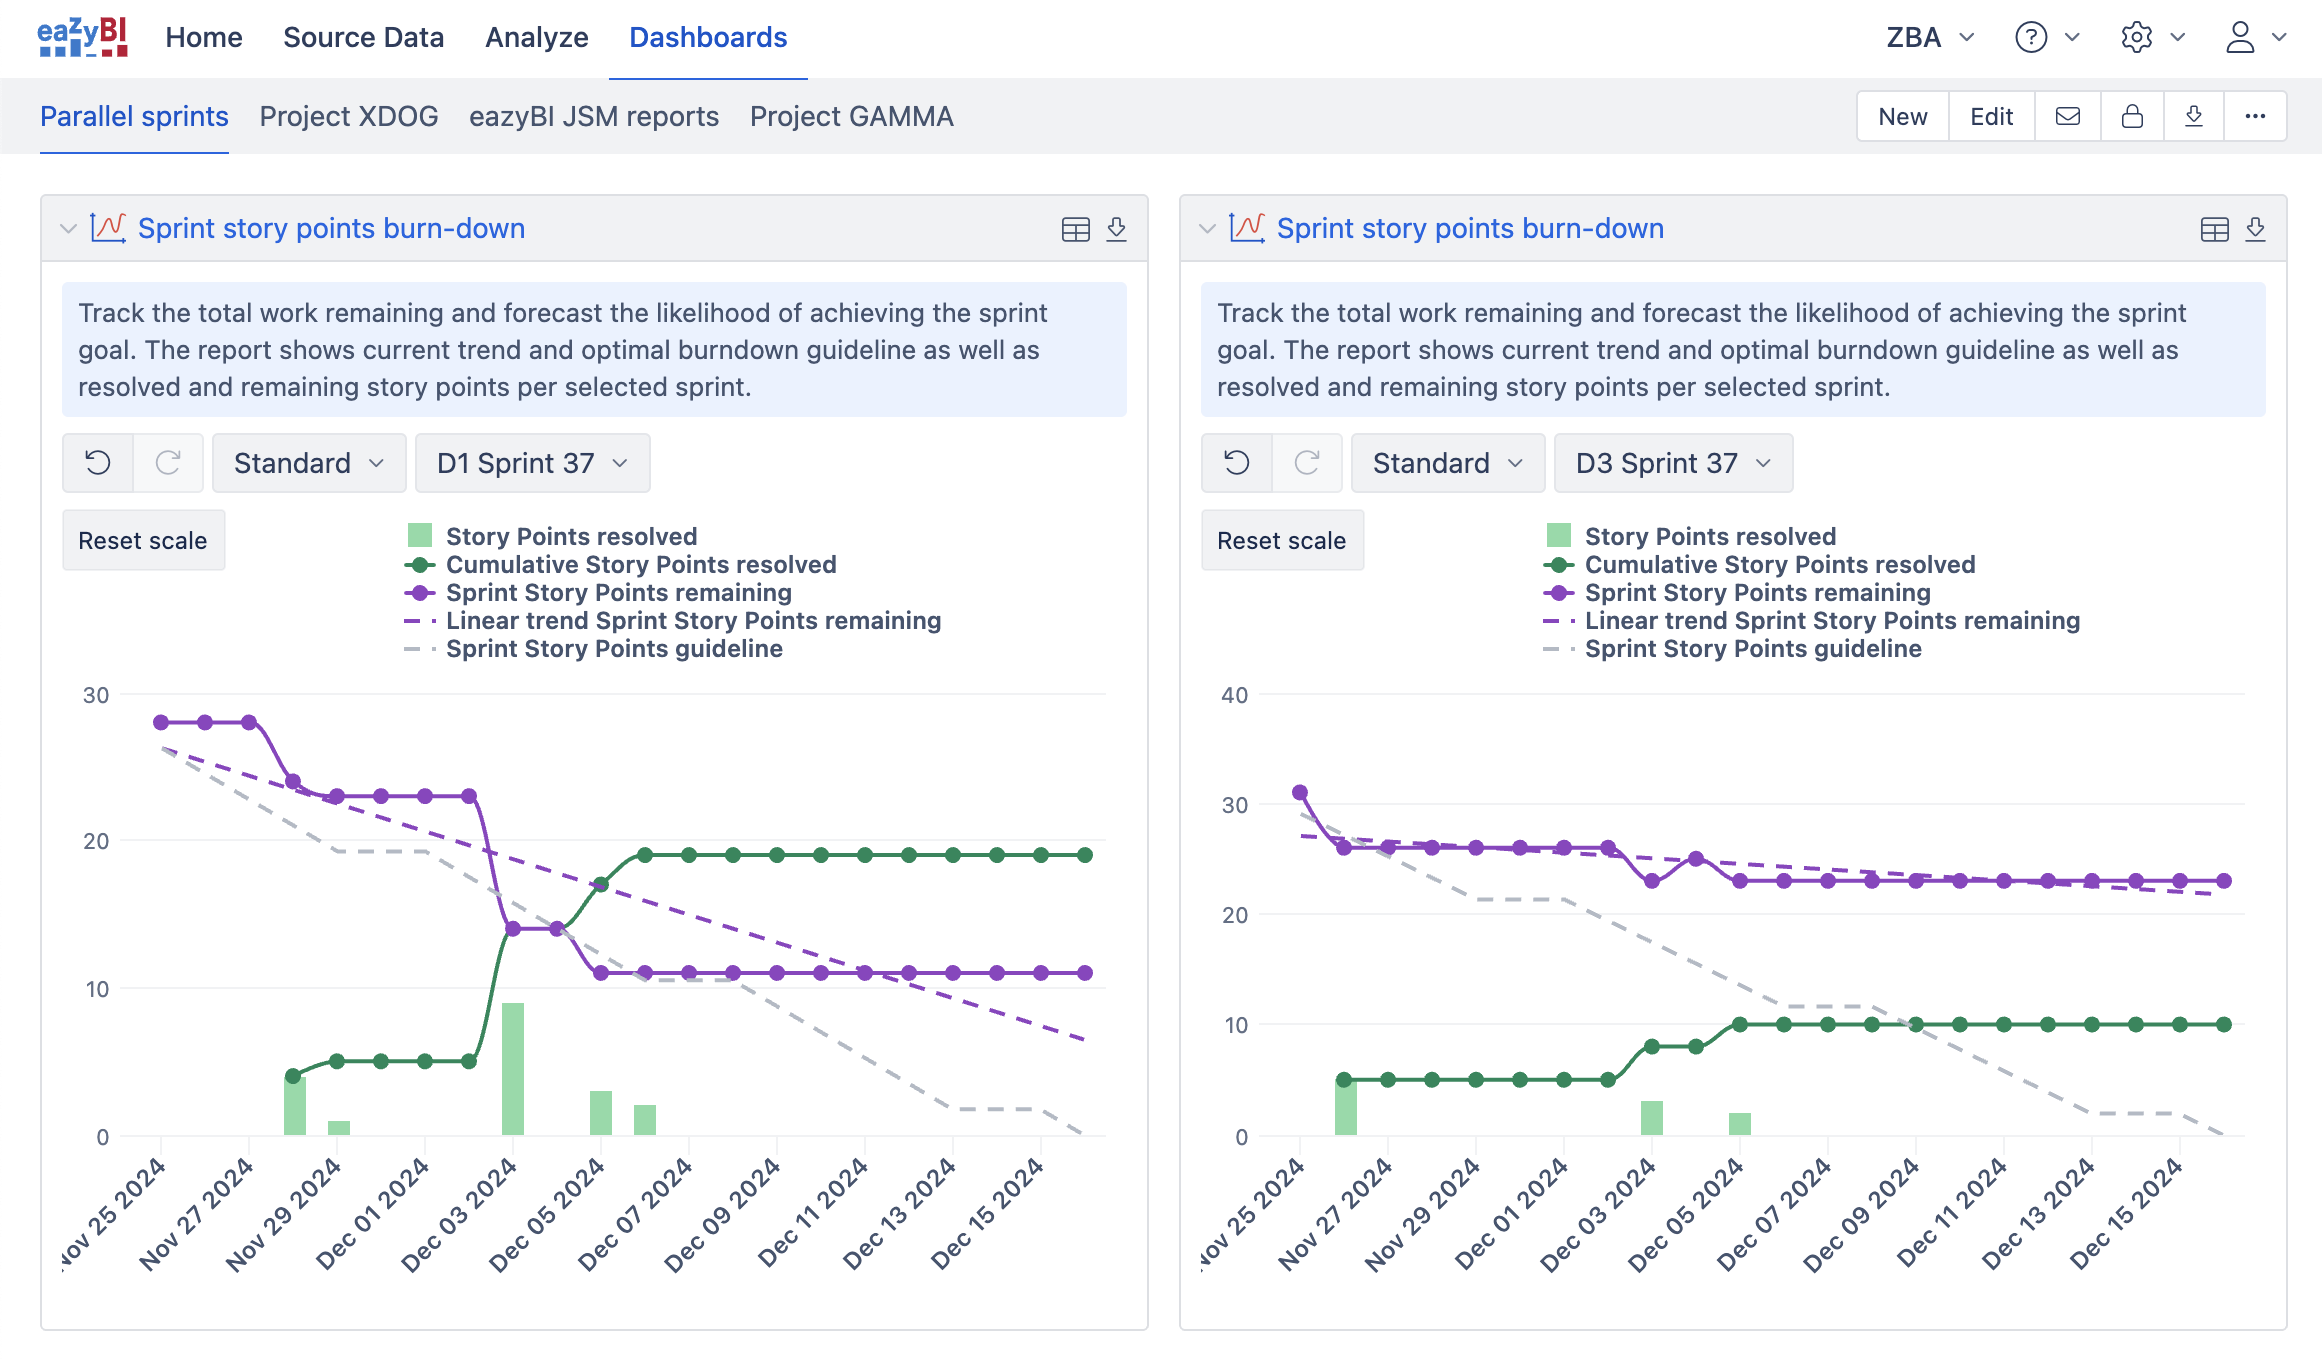
In case you publish reports on the Jira dashboard gadget “eazyBI report”, you may publish the same report several times on the same dashboard. And for each published version, specify the filter value for a Program Increment. There is instruction on how to save page filter values in gadgets: Publish in Jira dashboards - eazyBI for Jira.
Best,
Zane / support@eazyBI.com
I am unable to add the same report multiple times to the dashboard. Am I missing something?
Hi @Pre,
Currently, one report can be added to the same eazyBI dashboard only once. We have such an improvement in our backlog to add the same report multiple times with different page filters to the eazyBI dashboard. I can not give any estimates of when this feature will be available, but I will put an update in this Community post.
However, you may add the same report multiple times to the Jira dashboard using eazyBI gadgets.
Bets,
Zane / support@eazyBI.com
Hi,
We recently released eazyBI version 8.0.1. This version includes the option to add multiple instances of the same report to a eazyBI dashboard and use different page filter selections. This feature is also available on the Cloud.
Best regards,
Zane / support@eazyBI.com
1 Like