Hello to all, i’am trying to use the measures sprint issues completed / sprint issues added to generate a bar chart but when i click
on the bar chart Eeazy bi Generate only one chart how can i solve this ?
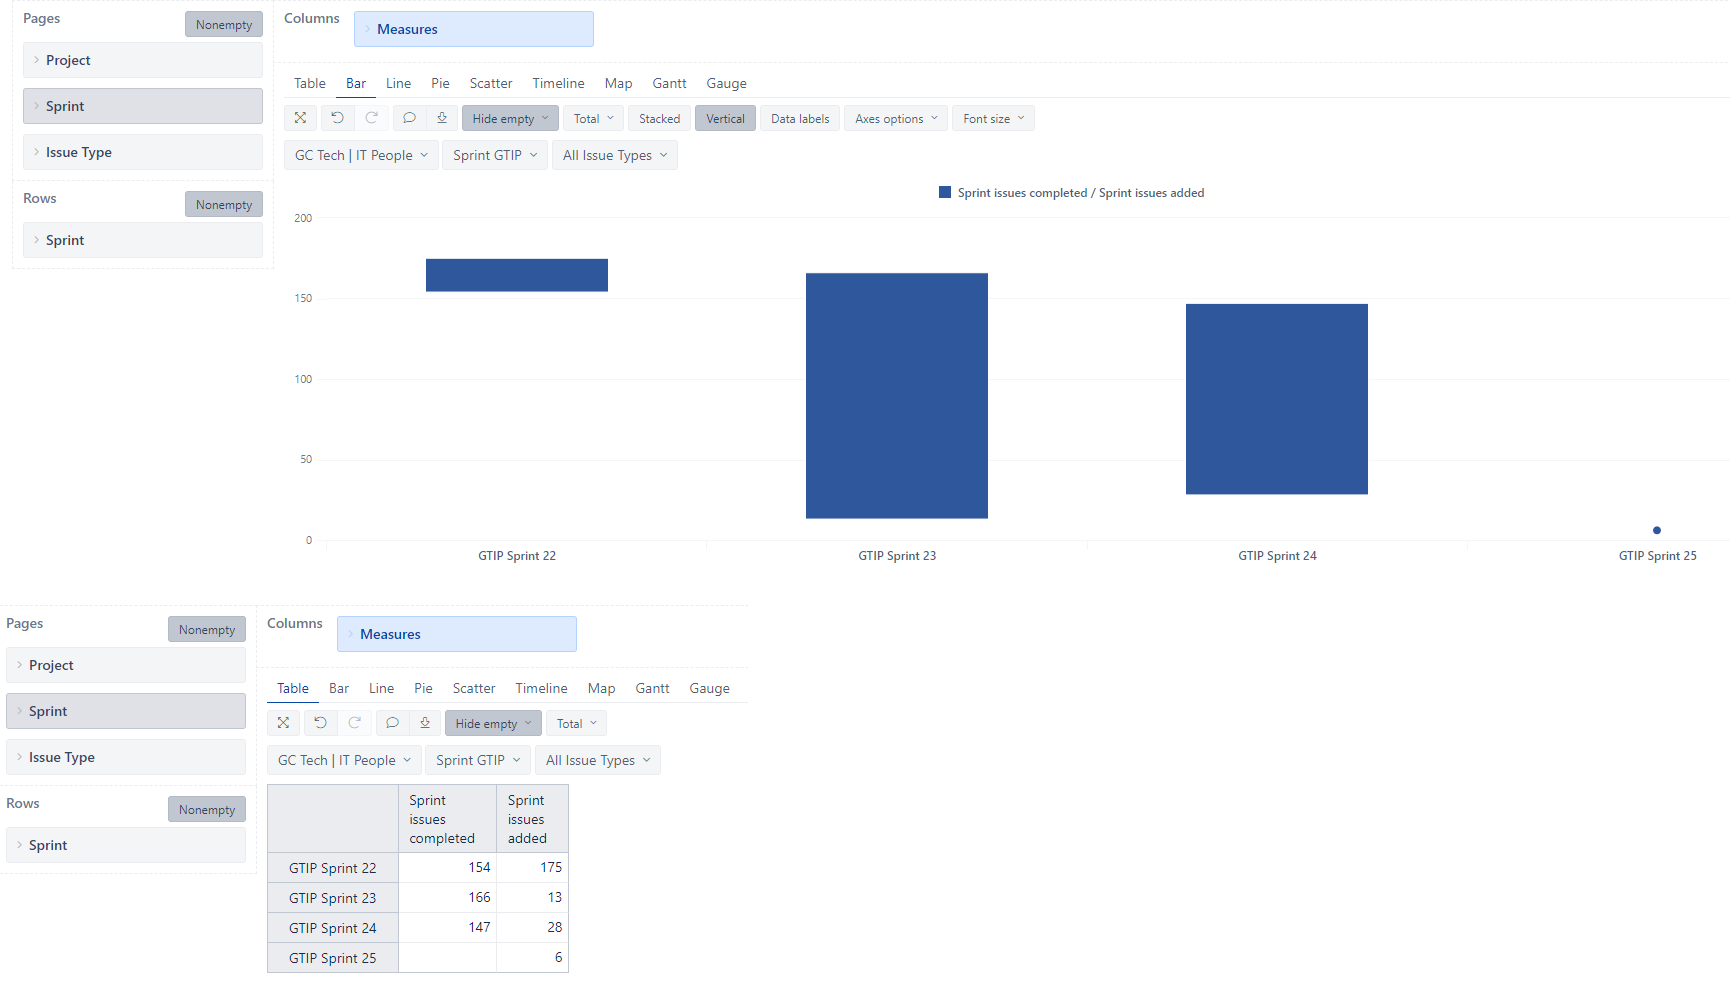
Hi @Lucas_Silva_Dantas_A ,
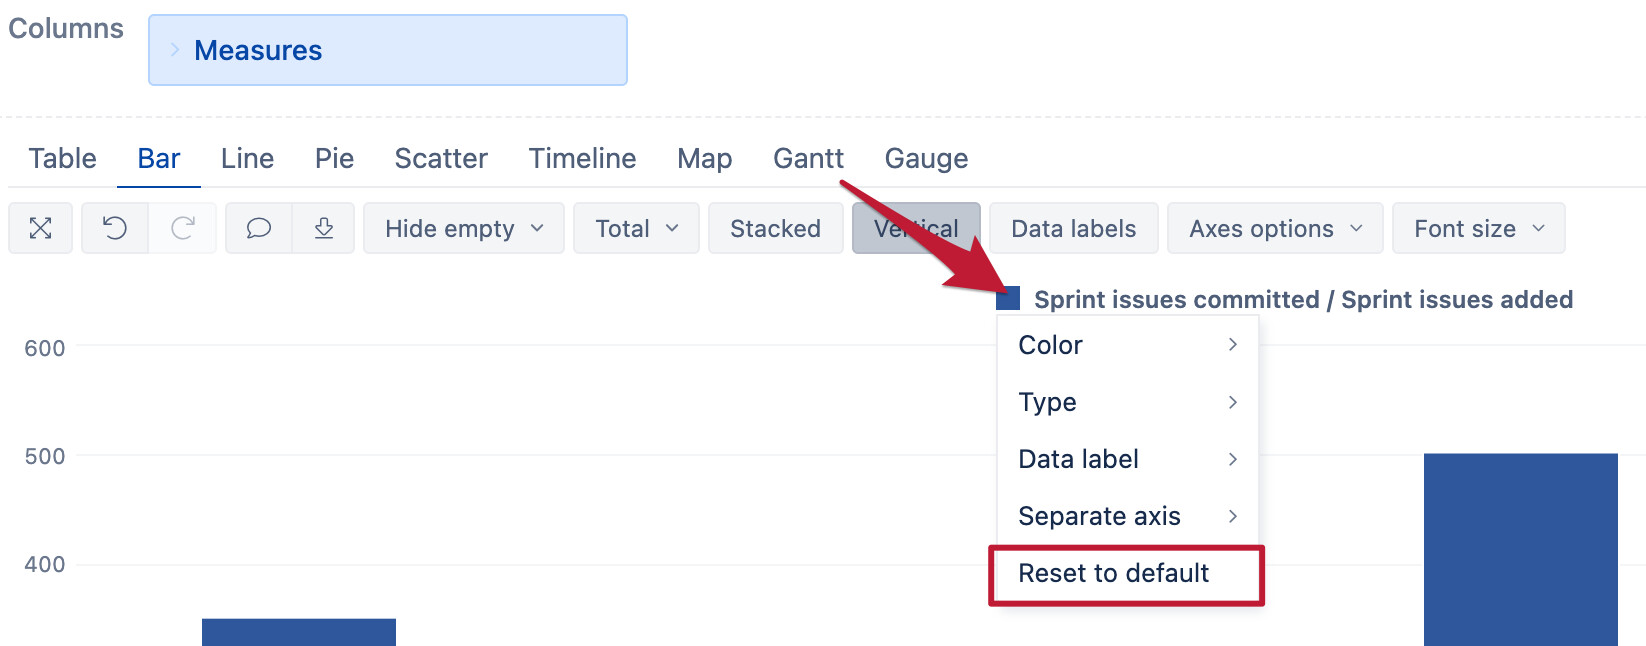
It looks like you have applied a “Range” chart type for your measure “Sprint issues completed” that will create a range bar with the measure next to it. You can see this training video on where that could be useful: Training videos
Press “Reset to default” to see each measure separately:
best,
Gerda // support@eazyBI.com
Hi @gerda.grantina i tried to make like you showed to me, but it doesn’t worked as you can see in this link where i recorded a video showing i
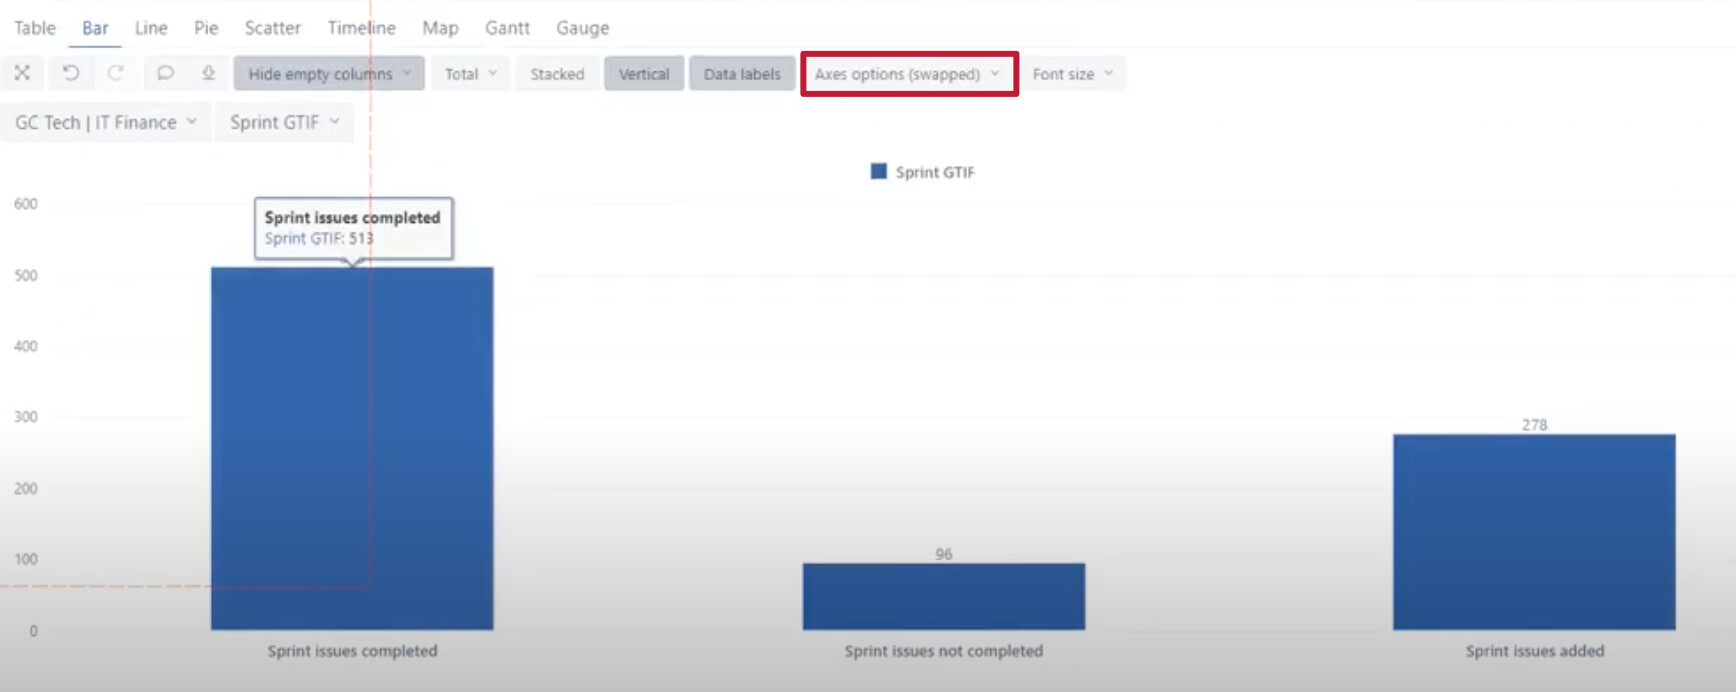
Hi @Lucas_Silva_Dantas_A
Please re-swap your axis, if you want to see sprints on the x-axis and measures per each sprint separately:
best,
Gerda