From this report I can calculate the projected achievable scope of story points that will be completed by the release date. Now in case version scope exceeds this, I would like to create a stacked bar diagram with three groups “Done”, “Will be done according to prediction” and “Will not be done according to prediction”. The bar diagram could be in the same or in another report and the logic should be that issues and their story points are summed up in order of issue rank. Once the projected achievable scope is reached the issues should go into the category “Will not be done according to prediction”.
I don’t really kow how to approach this and would appreciate if someone could point me in the right direction.
I am sorry your request hasn’t received any attention so far. While it is possible to add the bar chart to the same report, unfortunately, you won’t be able to order the Drill through issue result by the issue rank.
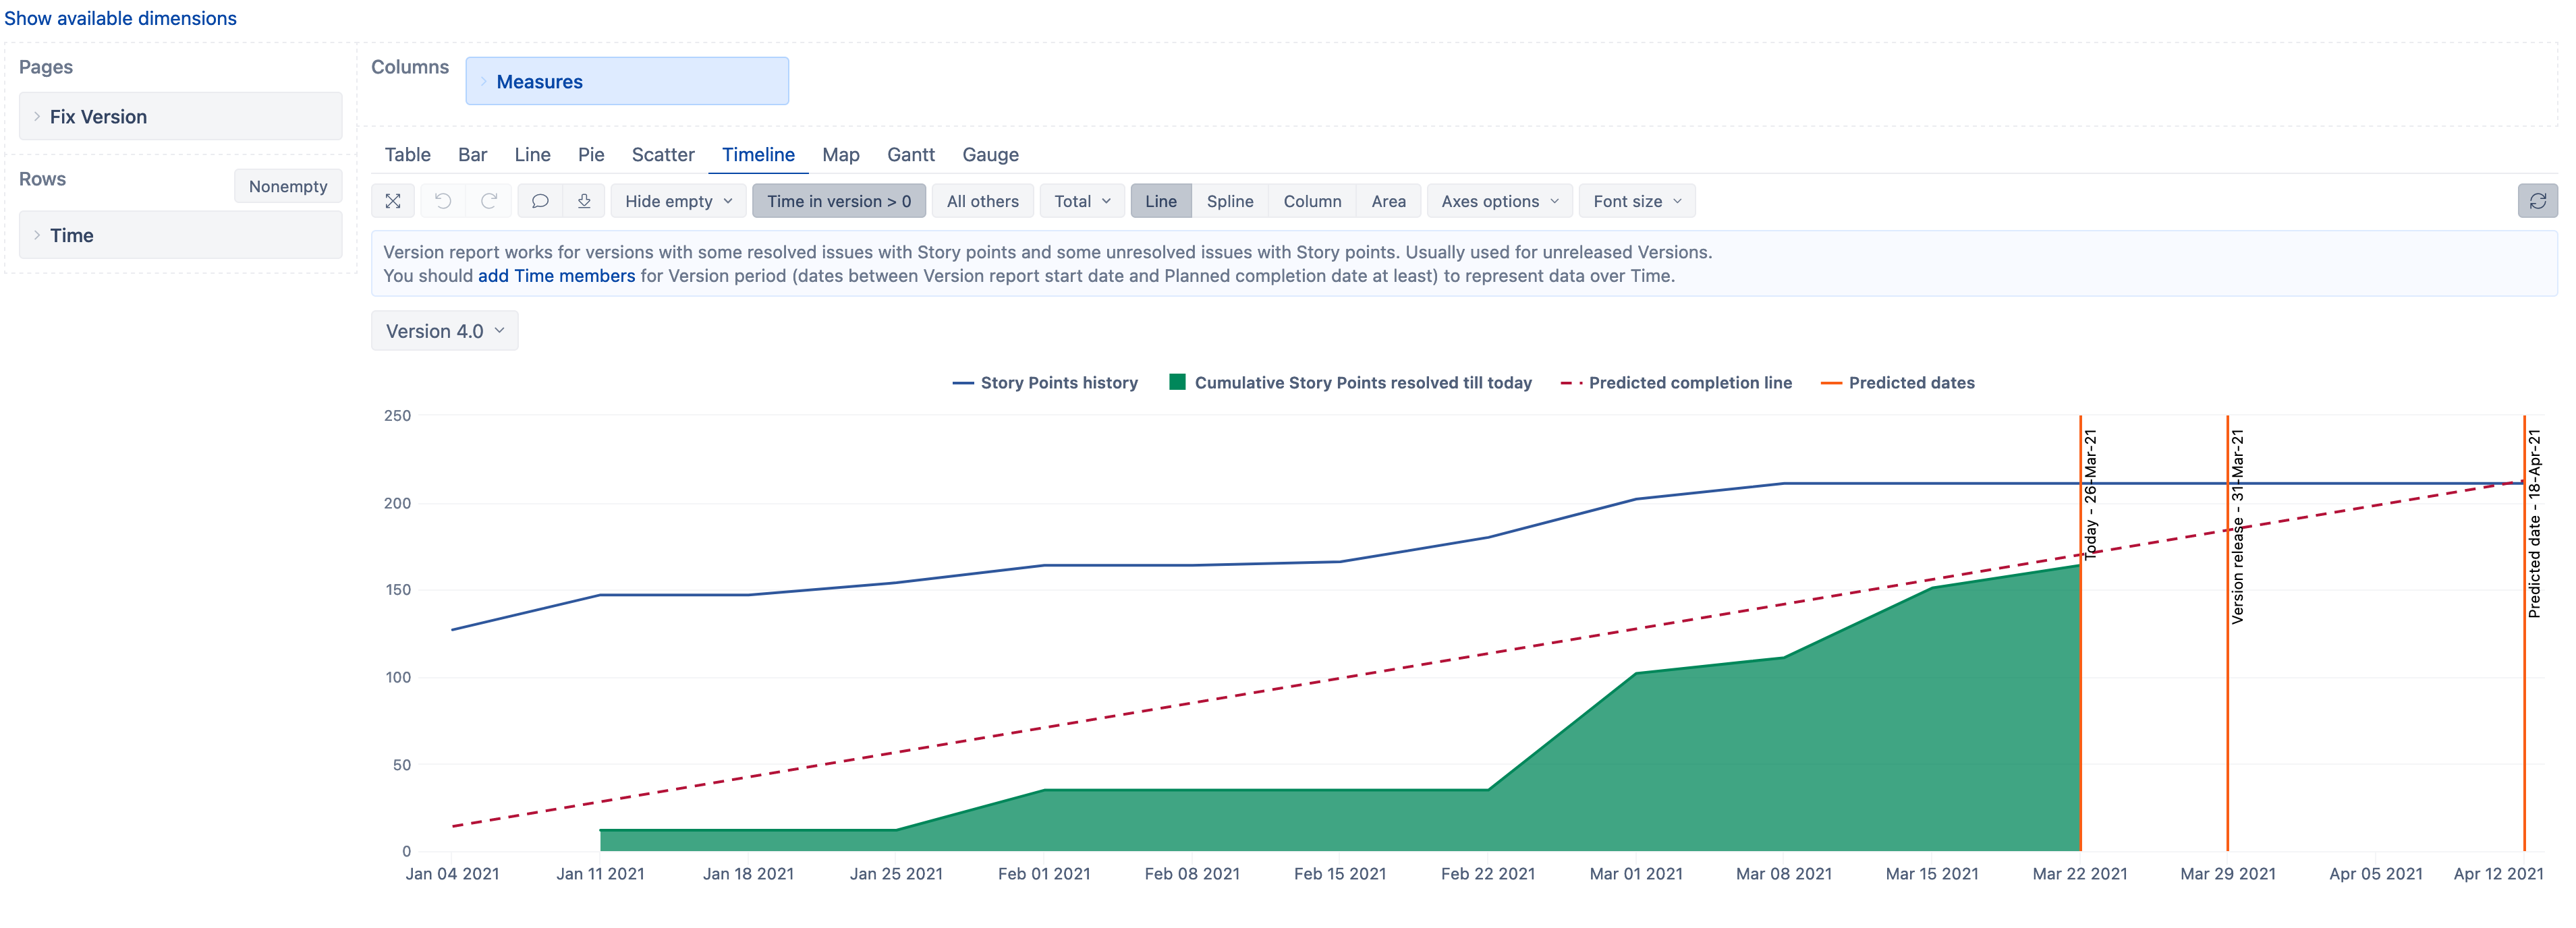
Instead, I recommend creating a new report with the Issue dimension “Issue” level members in the report, ordered by rank and coloring by the achievable scopes with the help of cell formatting. Then you can put both reports side-by-side in an eazyBI dashboard. See the original Version report below:
See the formulas to calculate the “To Be completed”, “Will not be completed” measures below:
To Be completed:
Case when
  -- show any past periods
  DateAfterPeriodEnd(
    "Today",
    [Time].CurrentHierarchyMember)
  OR
  -- show current period
  DateInPeriod(
    "Today",
    [Time].CurrentHierarchyMember
  )
Then
  CoalesceEmpty(
    CASE WHEN [Measures].[Scope] > [Measures].[Story points history]
    THEN
    [Measures].[Story Points history]-
    [Measures].[Cumulative Story Points resolved]
    WHEN [Measures].[Scope] <= [Measures].[Story points history]
    THEN
    [Measures].[Scope]-
    [Measures].[Cumulative Story Points resolved]
    END,
    0
  )
End
Will not be completed:
Case when
  -- show any past periods
  DateAfterPeriodEnd(
    "Today",
    [Time].CurrentHierarchyMember)
  OR
  -- show current period
  DateInPeriod(
    "Today",
    [Time].CurrentHierarchyMember
  )
Then
  CoalesceEmpty(
    CASE WHEN [Measures].[Story Points history] > [Measures].[Scope]
    THEN
    [Measures].[Story Points history]
    -
    [Measures].[Scope]
    END,
    0
  )
End
They both use a measure “Scope”, which should hold the number of Story Points you want to complete in the version. In my case, it is calculated on the intersection of the version release date and the predicted completion line, so it changes. In your case, it might be a hardcoded number.