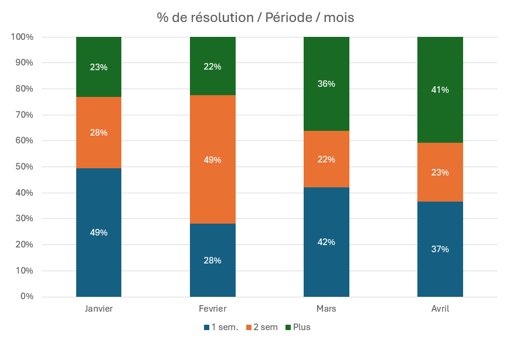
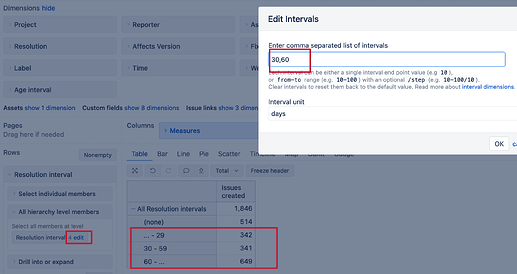
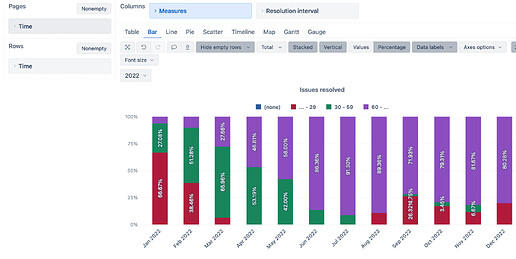
I’m trying to create a stacked bar graph of the monthly percentages of tickets resolved in three time periods (first week, second week, more).

My idea was to create a measure expressing the resolution time for each ticket, and to base three additional measures on that measure to create the graph. However, I’m running into multiple roadblocks:
Regarding the measure to calculate the time between the creation date and the resolution date of the ticket, I’m using the following formula:
SUM(Filter(
Descendants([Issue].CurrentMember,[Issue].[Issue]),
DateInPeriod(
[Measures].[Issue created date],
[Time].CurrentHierarchyMember
)), DateDiffDays(
[Issue].CurrentHierarchyMember.Get(‘Created at’),
[Issue].CurrentHierarchyMember.Get(‘Resolved at’)
))
This seems to generate the desired data, but ignores the filters I’m using in the “Pages” section.
When turning to the three measures calculating the percentage of tickets resolved in a timeframe, I wrote the following formula (for tickets resolved in the first week; “Days between creation and resolution” is the name of the measure defined above):
(Count(
Filter( [Measures].[Days between creation and resolution],
[Measures].[Days between creation and resolution] <= 168
))) / [Measures].[Issues created]
However, this does not seem to work at all.
Thanks in advance for pointing out what I’m doing wrong and how I can correct my formulas!

