Hi,
I see a lot of great info on conditionally coloring cells in a table based on the values in the cell. Is there a way to color a specific cell (not an entire row/column, just one cell) such that it is NOT dependent on the value? (Similar to the background color of a cell in excel, not conditionally formatted. So the cell at “B11” in excel terms is always red as an example)
More detailed use case - We have a table where columns track what phase an issue was detected (Say by the ‘customer’) and rows track what phase issues were injected (say at ‘Design’). The goal of the table is to show how long issues exist across phases of a product before they are identified. The further down stream they are caught, the more concern there should be. So we would want each cell in a table to always be a static color (ie the cell in Row X and Column Y would always be red, independent of the value in the cell. Row X Column B would be green, etc).
Thanks!
Hi @RBall07,
Currently, cell formatting allows you to set the color to a whole row/column or set the color for a cell-based on its value. You can use a combination of those or color all rows or importance. For example, set the formatting for row X and represent values in a neutral color and bold (just to draw attention), and set red color for column Y and green color for column B.
More details on cell formatting are described here: https://docs.eazybi.com/eazybijira/analyze-and-visualize/create-reports#Createreports-Conditionalformattingoncells.
We (eazyBI) are working on new features for cell formatting that might give you more freedom and set more complex conditions, but I can not give you an estimate when it is available.
Best,
Zane / support@eazyBI.com
Thanks Zane, appreciate the response. Here is an example of what I am looking to create with eazyBI, for consideration as a new feature.
1 Like
With version 6.2. and on the cloud, we released improved cell formatting functionality. We added the option to use a custom code instead of a value in the cell to set the coloring rules.
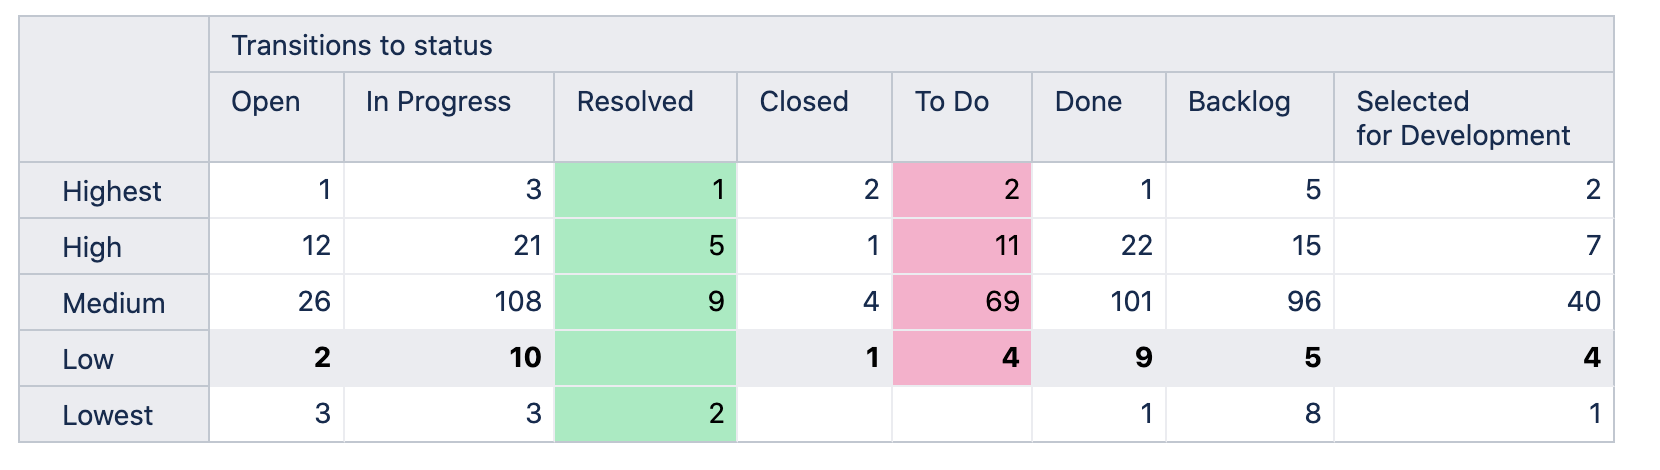
For this report, you can use dimensions representing Anomaly injected and Anomaly detected on rows and columns. Then use some measure, for example, Issues created, to show the count of issues per cell.
For this measure, add the cell formatting and use a custom formula specifying the combinations of dimension members names for Anomaly injected and Anomaly detected. Here is a report example with custom calculation based on Priority and Status names in our demo account you can use as an example.
Daina / support@eazybi.com