First time posting here on this community. Thanks in advance for any help you can provide. 
We have stories that are linked to defects using the link type: “blocks/is blocked by”. e.g. “Story 1 is blocked by Defect 1” and I’m looking to try and get a table similar to below to be built dynamically so that when a new defect is linked to a Story, it would appear in the list. I have managed to import the “blocks/is blocked by” link type as a dimension into EazyBi, but can’t seem to get the linked defects attributes/info into the body of the table, it keeps pulling in the linked Issues (Story) attributes. e.g. if I add a measure of “Created date”, this pulls in the Stories “created date” and not the linked defects “created date” as I expected it to. I tried putting the “blocks/is blocked by” dimension first in my list of rows, but this doesn’t help.
Any help on this would be greatly appreciated as I’ve been struggling with this for a few days now.
Hope the above makes sense.
Header row in table below are “Defect Severities”
| A |
B |
1 - Critical |
2 - High |
3- Medium |
4 - Low |
| Story 1 |
Defect 1 |
1 |
|
|
|
|
Defect 2 |
|
1 |
|
|
| Story 2 |
Defect 1 |
|
|
1 |
|
|
Defect 2 |
|
|
1 |
|
|
Defect 3 |
|
1 |
|
|
| Story 3 |
Defect 1 |
1 |
|
|
|
|
Defect 2 |
|
|
|
1 |
Hi @rickanv
Welcome to eazyBI Community!
When it comes to Linked issues counting, you’ll need to create custom-calculated measures.
Here is a good sample report to use as a cheat sheet for formulas when reporting on linked issues Story and Bug overview by projects - Issues - eazyBI Demo Training - eazyBI or here is another good report to use as an example - Stories with Bugs details - Issues - eazyBI Demo Training - eazyBI. You can copy the formulas to count the linked issues. Note that in these reports “Bugs” is the name of imported linked issues. Adjust the formulas accordingly replacing “Bugs” with the name of your linked issue dimension.
Here is an example on the calculated measure you could use to count the linked issues based on their Priorities. You will need to create as meany measures using this example, as many priorities you’d like to count.
So for example, to count Critical linked issues, use the Formula below, replacing “Linked Issues” with the name you applied when defining your linked issue dimension/property. Use this same formula to count “High”, “Medium”, “Low”, replacing “Critial” in the formula below with the respective Priority.
Case
When
  [Issue].CurrentMember.Level.Name = "Issue"
  AND
  [Linked Issues].Currentmember is [Linked Issues].Defaultmember
Then
  -- retrieve Linked Issues information from Issue property linked issues
  Nonzero(Count(
    Filter(
      [Issue].CurrentHierarchy.GetLinkedmembers('Linked Issues'),
      [Measures].[Issue priority] = "Critical")
  ))
Else
 -- total calculation for any issue, data on Linked Issues level
  NonZero(Sum(
    Filter(
      DescendantsSet([Linked Issues].Currentmember, [Linked Issues].[Linked Issues]),
      [Priority].[Priority].getMemberNameByKey(
  [Linked Issues].CurrentHierarchyMember.get('Priority ID')
) = "Critical"),
      -- counts how many times Linked Issues are reference with issues, this works as a filter as well
    [Measures].[Issues created]
 ))
End
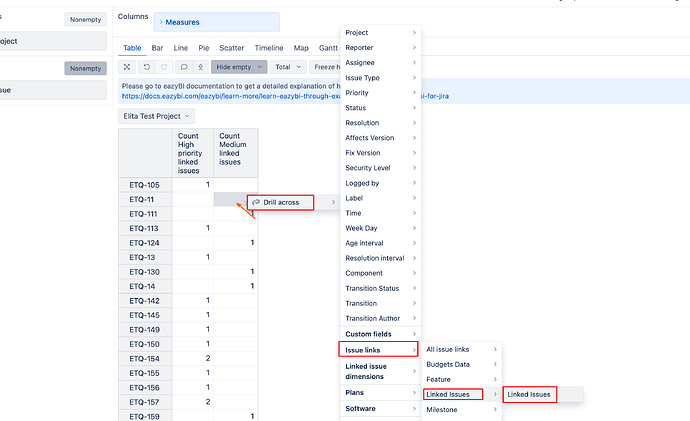
Note that if you’d like to see what linked issues are behind these values, you should use the Drill Across functionality → Issue link → Linked Issues (name you applied to import the linked issue dimension) → Linked issues
Similarly as in the screenshot below
Best wishes,
Elita from support@eazybi.com
![]()
