Hello.
Does exist some example or is possible to build a report that show the “Story Point Velocity”
Exemplo: Axis X we have the story points - 1,2,3,5,8,13,21
The other axis Y we have the averagy working days.
This will help to identify if our sprint planning is in the right way to estimate the stories.
You could use the Scatter chart type with two measures - Story points resolved and Average resolution days. On rows, you would add issues from the Issue dimension:
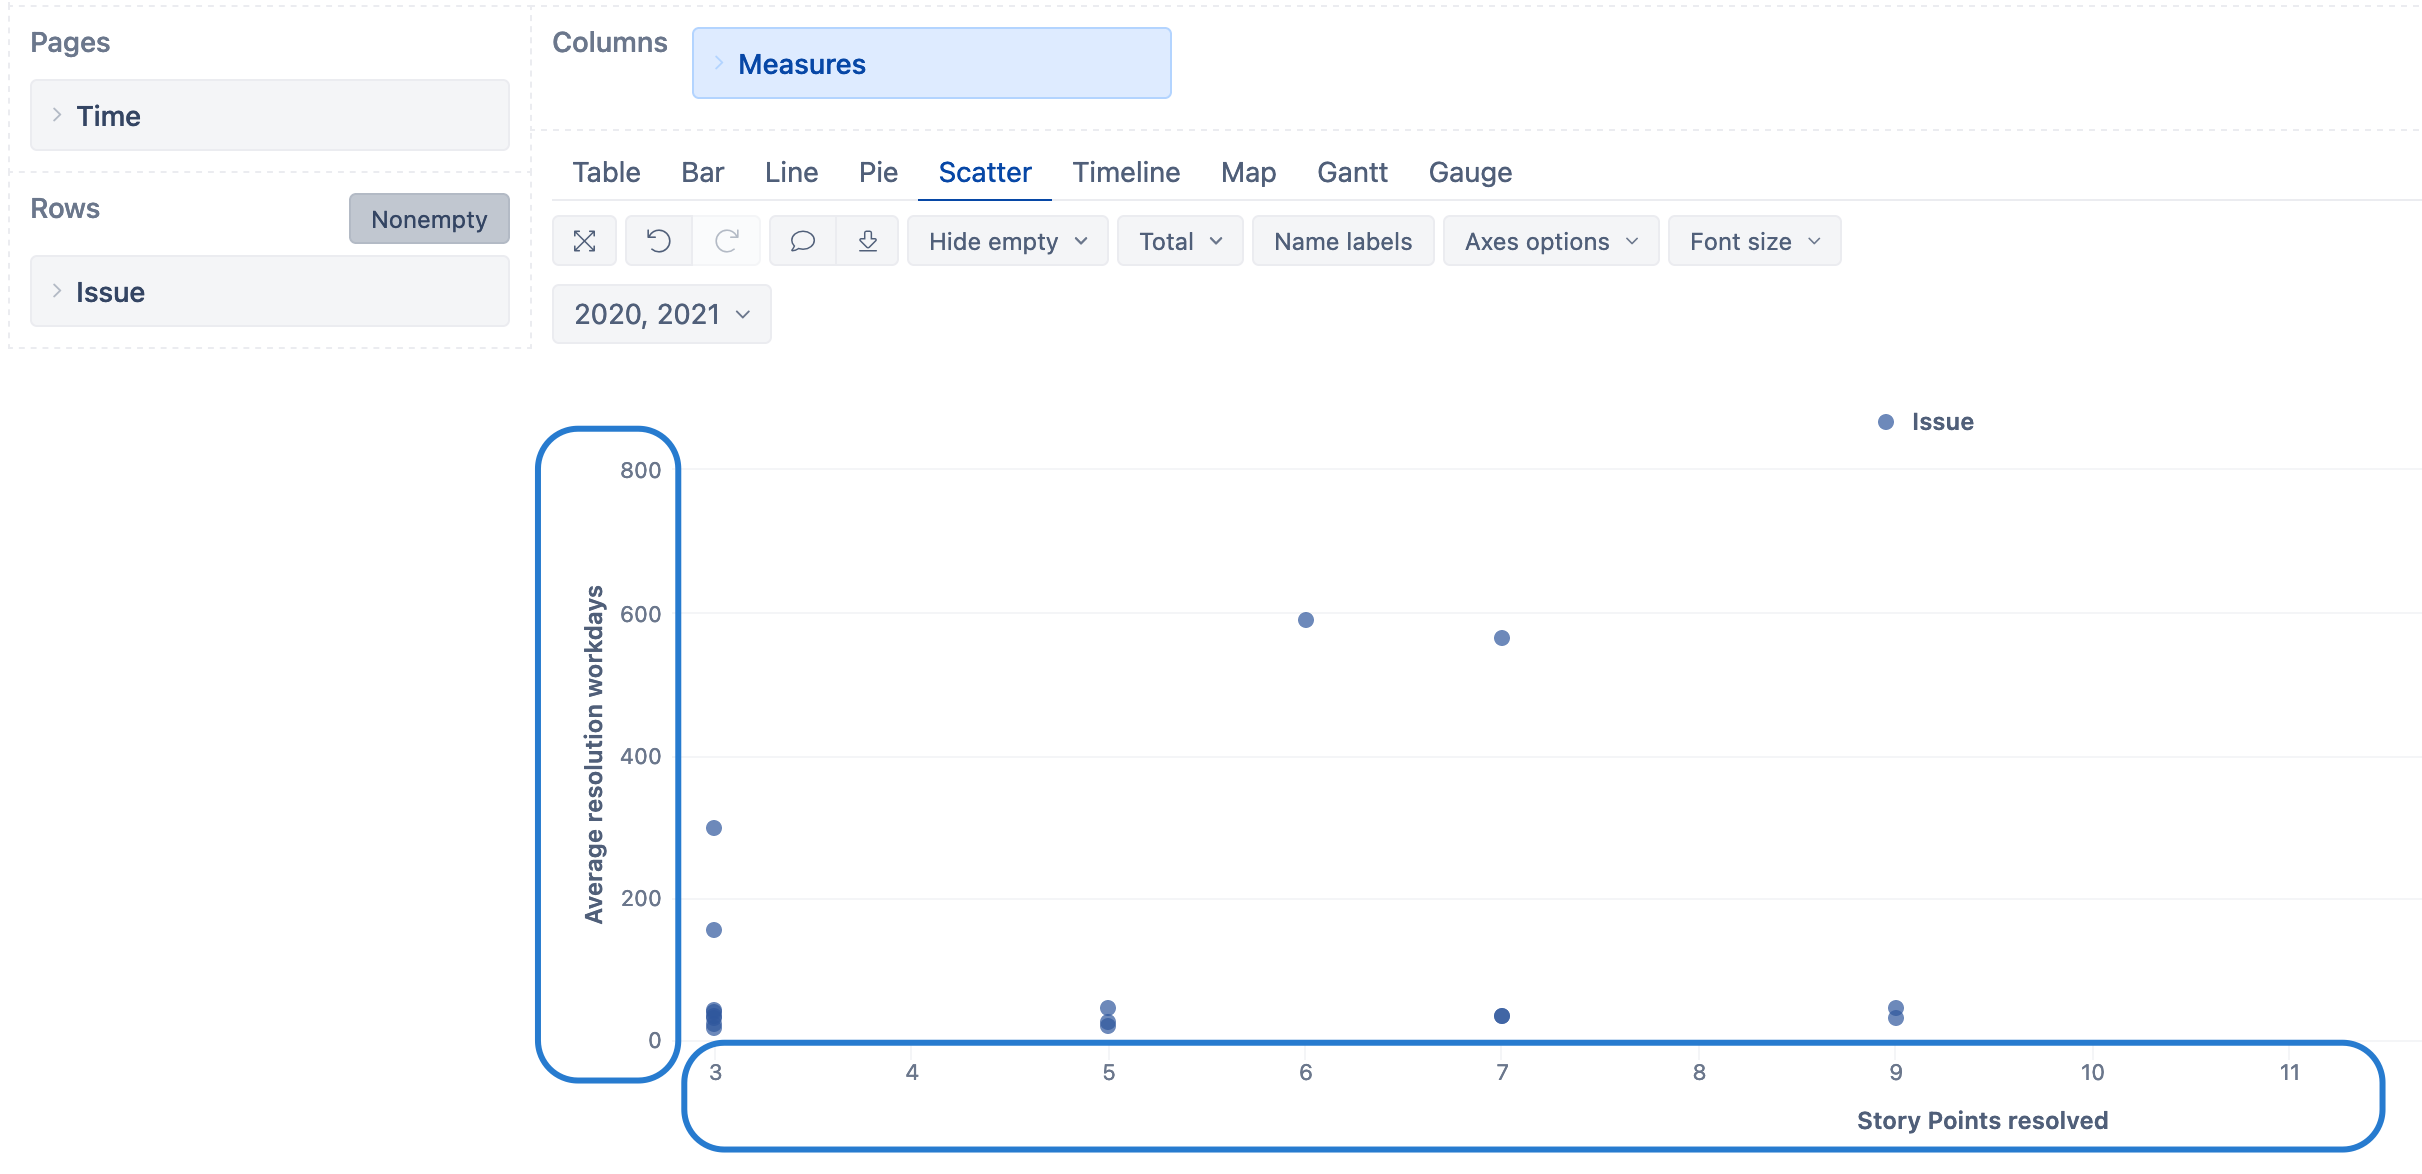
Let me know if that helped or if you have further questions regarding this!
Lauma / support@eazybi.com
1 Like
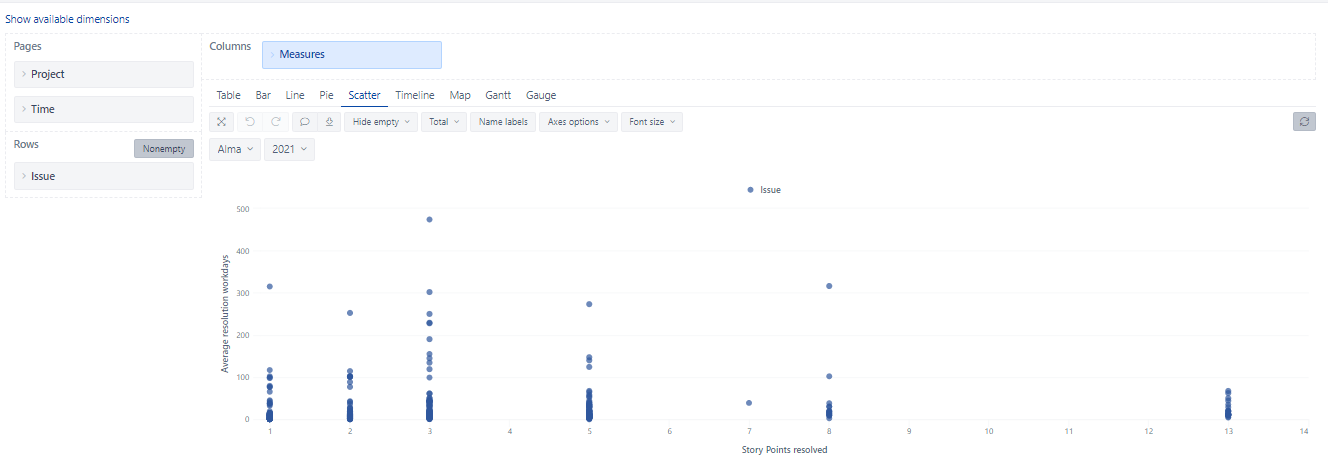
Hello, I working to create this chart. This look exactly what we are looking for.
Can you share other information when select the ISSUE and MEASURES dimensions? Here didnt’ show separately the stories points per number.
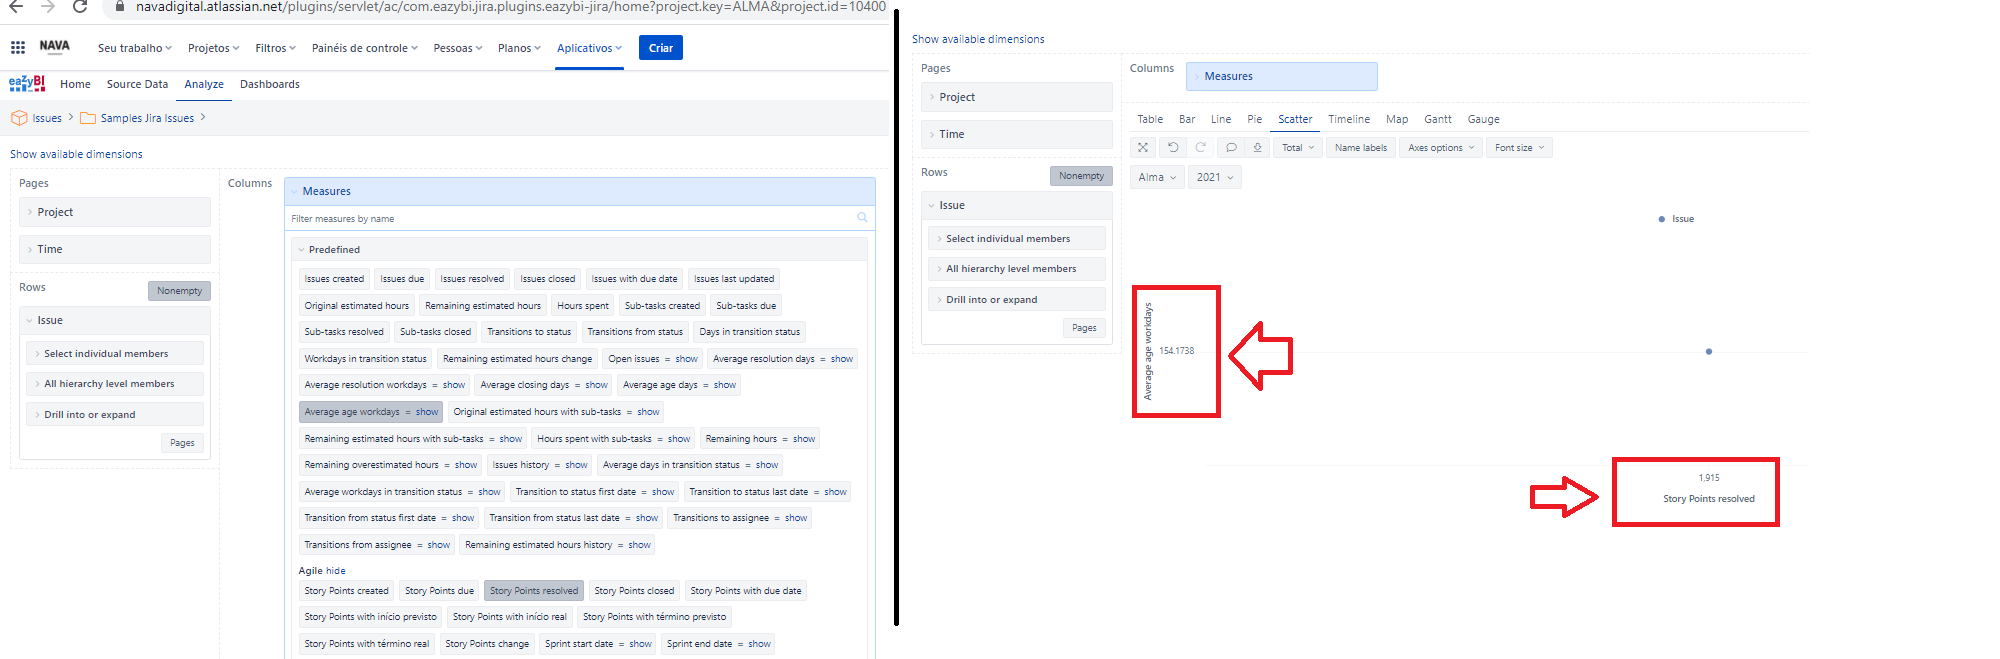
It seems you have done all the configurations correctly. Because of the page filter, you have only one issue (one scatter point), and only that issue story points are shown in the graph.
If you had more issues scattered, the x and y axes would draw dynamically other values.
The configuration I used is as follows:

Lauma / support@eazybi.com
1 Like
1 Like