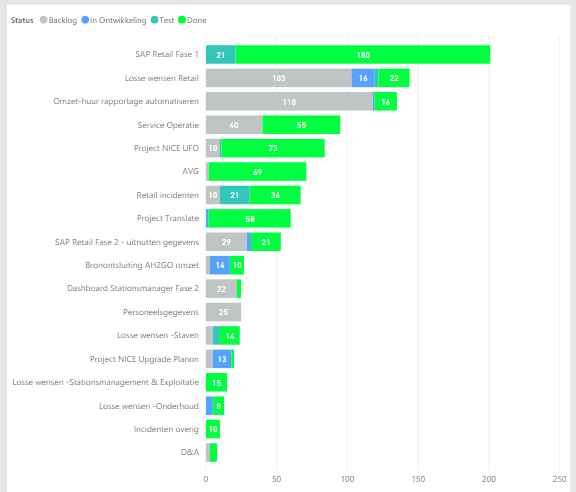
One of our users is migrating from Azure DevOps to Jira for Work Item management. In PowerBI they were able to create the report below. It shows from all stories in an epic what the amount of story points per state is.
I tried to make this report in EazyBI but I am not able to create it. Is there an example report I can use or is it simple to create and am I simply missing something.
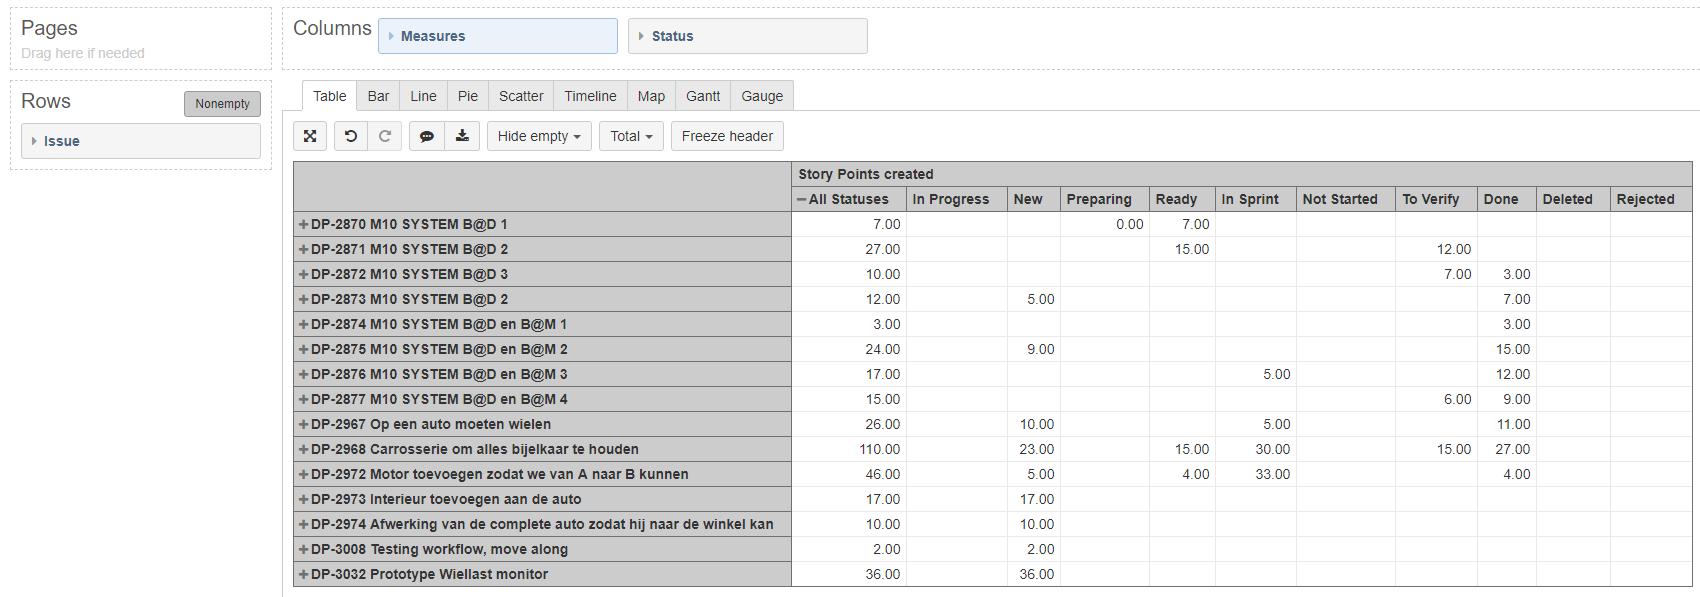
So I managed to create a first version of the report based on the content of our sandbox project. It gives me the sum of story points created and per state the issues are in. Next step is to replace the created story points by the actuals. I think I have to use the create a calculated member using the ‘Issue Story Points’ Property and the summarize function.
I am however getting stuck in the formula. Anyone who can help?
You are on the right track. Measure Story Points created represents actual story points assigned to an issue, the same value as issue property Issue Story Points. I would recommend using the measure Story Points created so you could aggregate story points and analyze from different perspectives (dimensions).
A couple improvements you may apply: set dimension Issue Type on pages to run a report for selected issue types like Epics and Stories. And remove column All Statuses to get a readable chart.
For data vizualization use Bar chart with stacked values.