Hi All,
I need to create a chart to show the time to recovery grouped by severity.
Each issue has a measure ‘Time to recovery’ and dimension ‘Severity’ (from S0 to S3).
How to calculate the sum of Time to Recovery depending on Severity?
Thank you!
Hi All,
I need to create a chart to show the time to recovery grouped by severity.
Each issue has a measure ‘Time to recovery’ and dimension ‘Severity’ (from S0 to S3).
How to calculate the sum of Time to Recovery depending on Severity?
Thank you!
Hi Julia,
You are writing that ‘Time to recovery’ is a measure of the issue, and ‘Severity’ is a dimension.
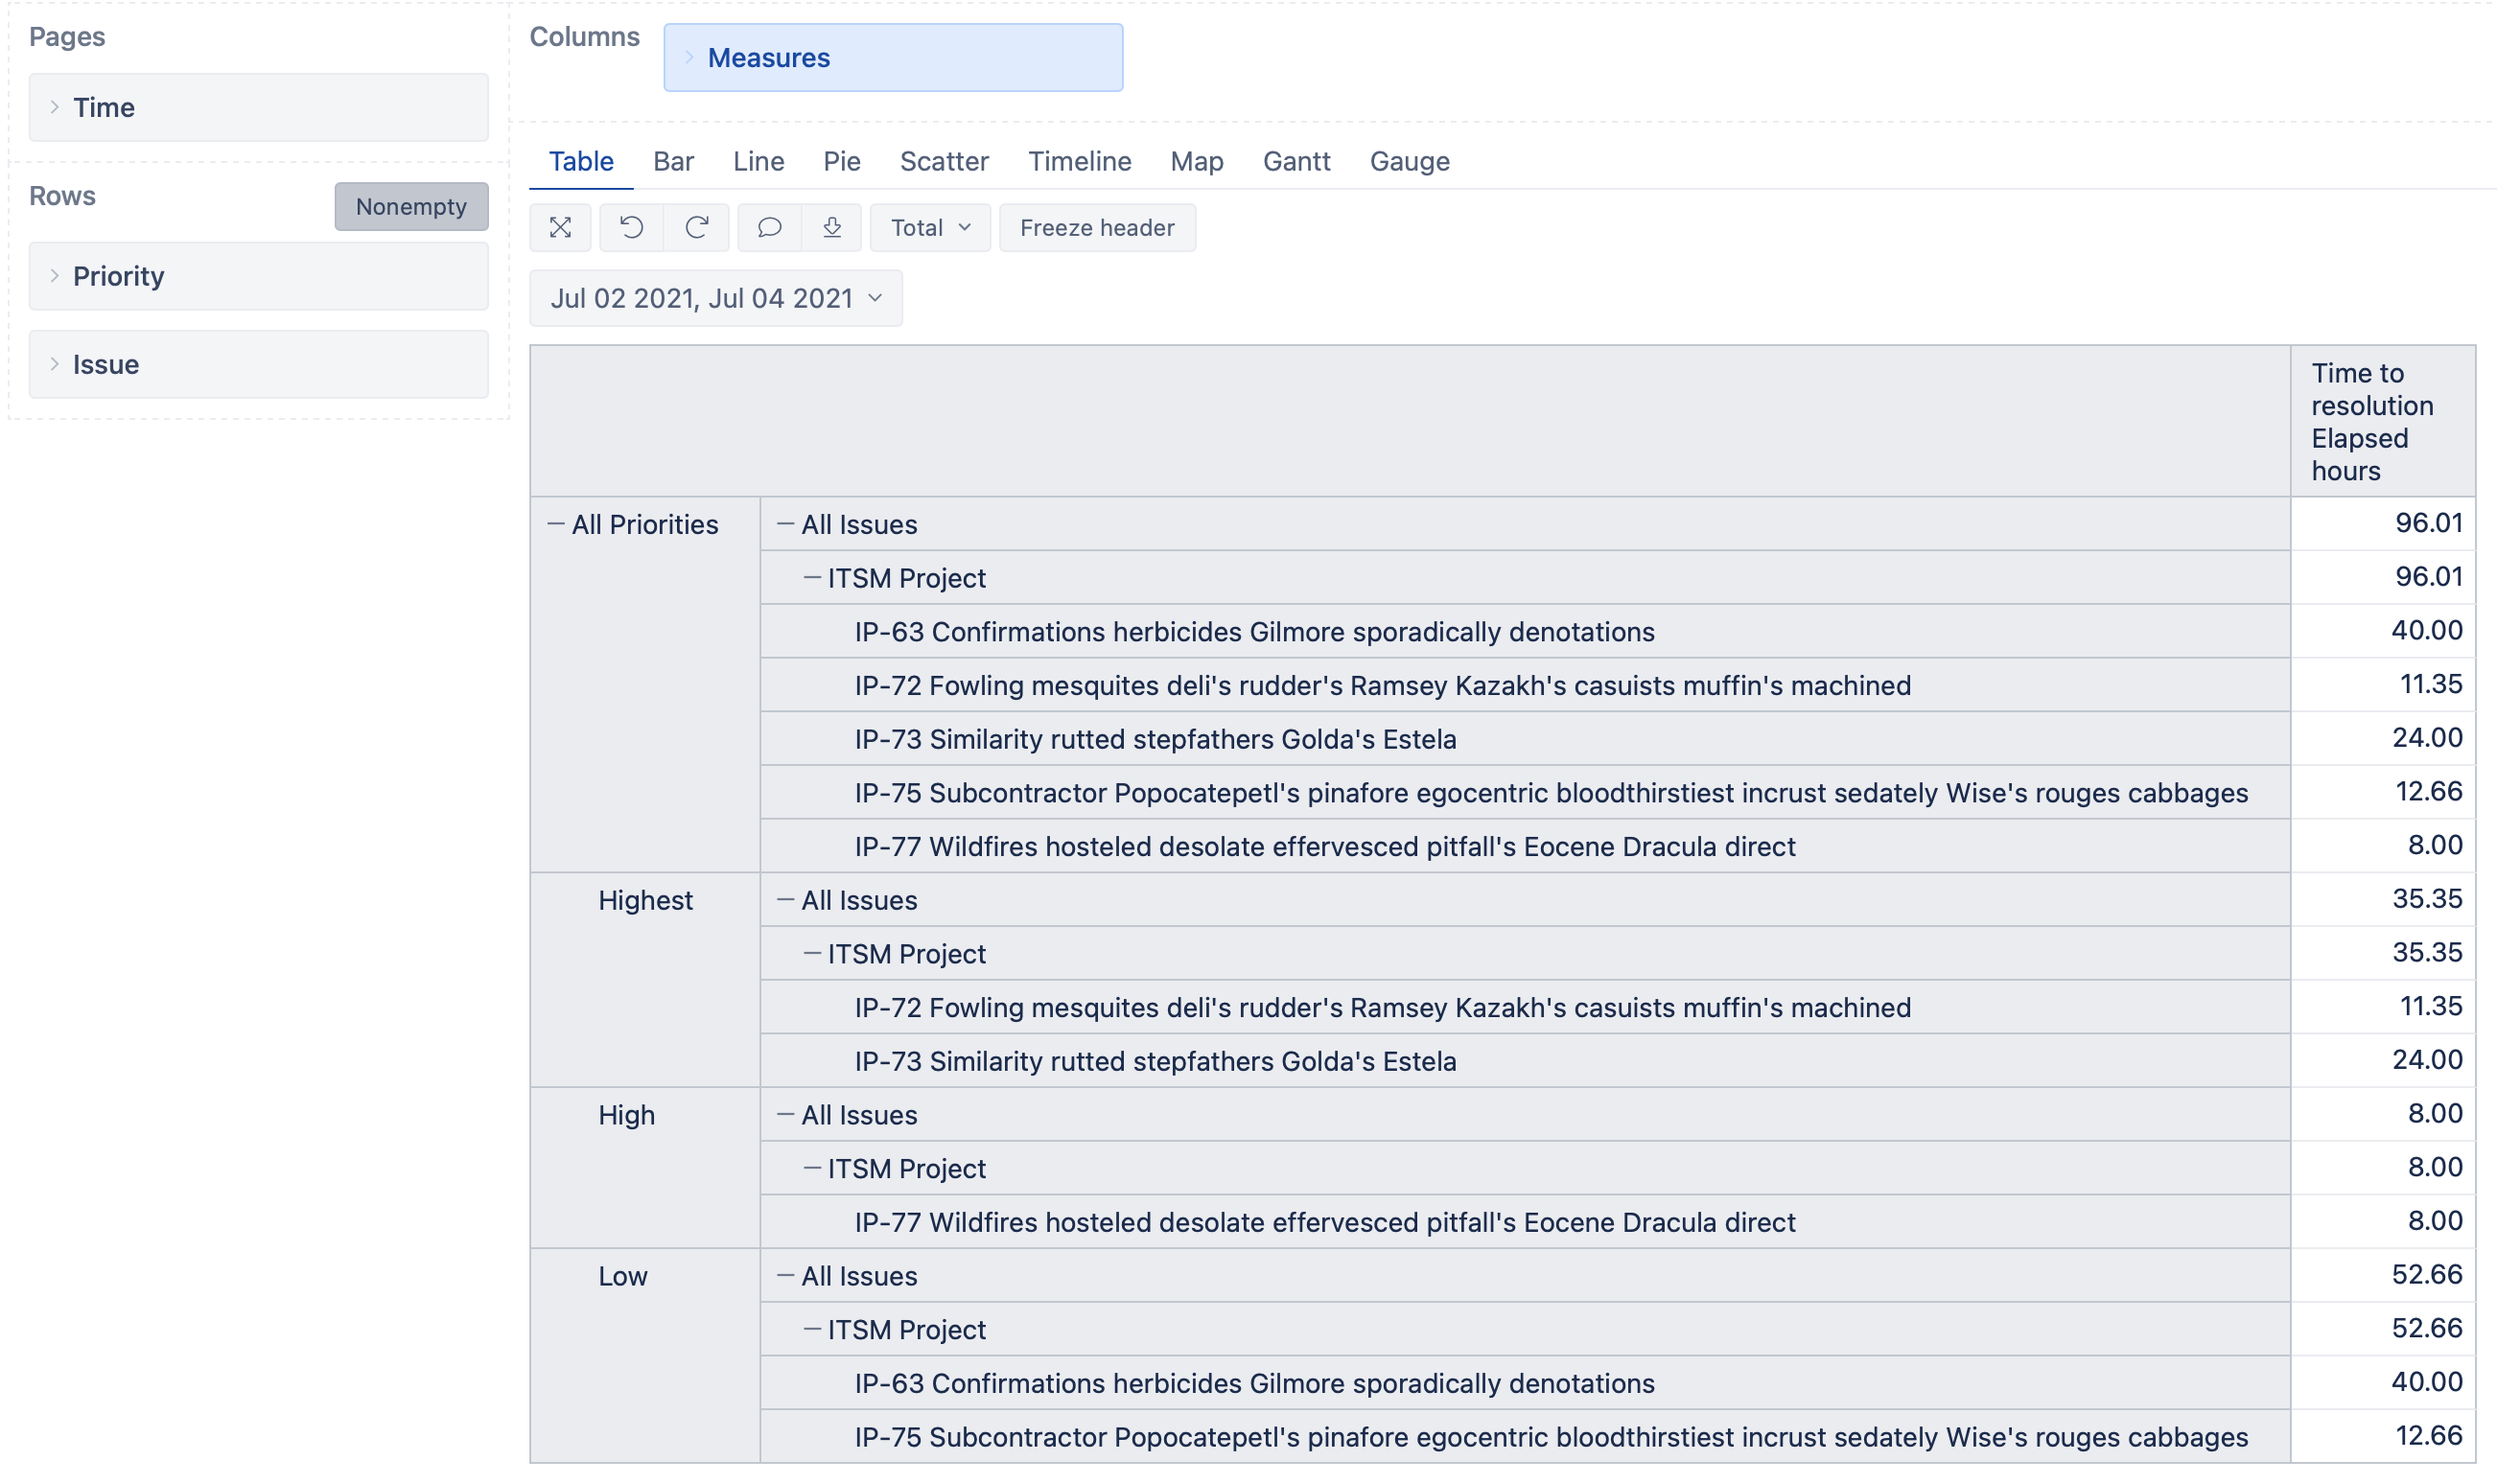
By adding the Severity dimension to the report rows and dragging it above the Issue dimension, you may group issues by the Severity.
Then you will get calculated measures aggregated at the higher dimension member levels.
Please see the below image - subtotals are calculated automatically.
I used different dimension Priority and the measure ‘Time to resolution Elapsed hours’ - but the behavior is the same.
I also added the Time dimension to the page filter to limit the number of issues displayed.
Should you have any more specific questions - please do not hesitate to write to support@eazybi.com.
Kind regards,
Oskars / support@eazybi.com