Hi
I’m new to EasyBI, and am finding it powerful.
We are using tempo timesheets for recording time and are measuring the original estimate, timespent and remaining estimate as well as forecasting the final hours (timespent + remaining hours)
We are using the hierarchy of project → epic → story → subtask and the hours should rollup up:
Story hours = hours on the story + the hours spent on the subtasks
Epic hours = hours on the Epic + Story hours as above
Project hours = hours on all the epics as above
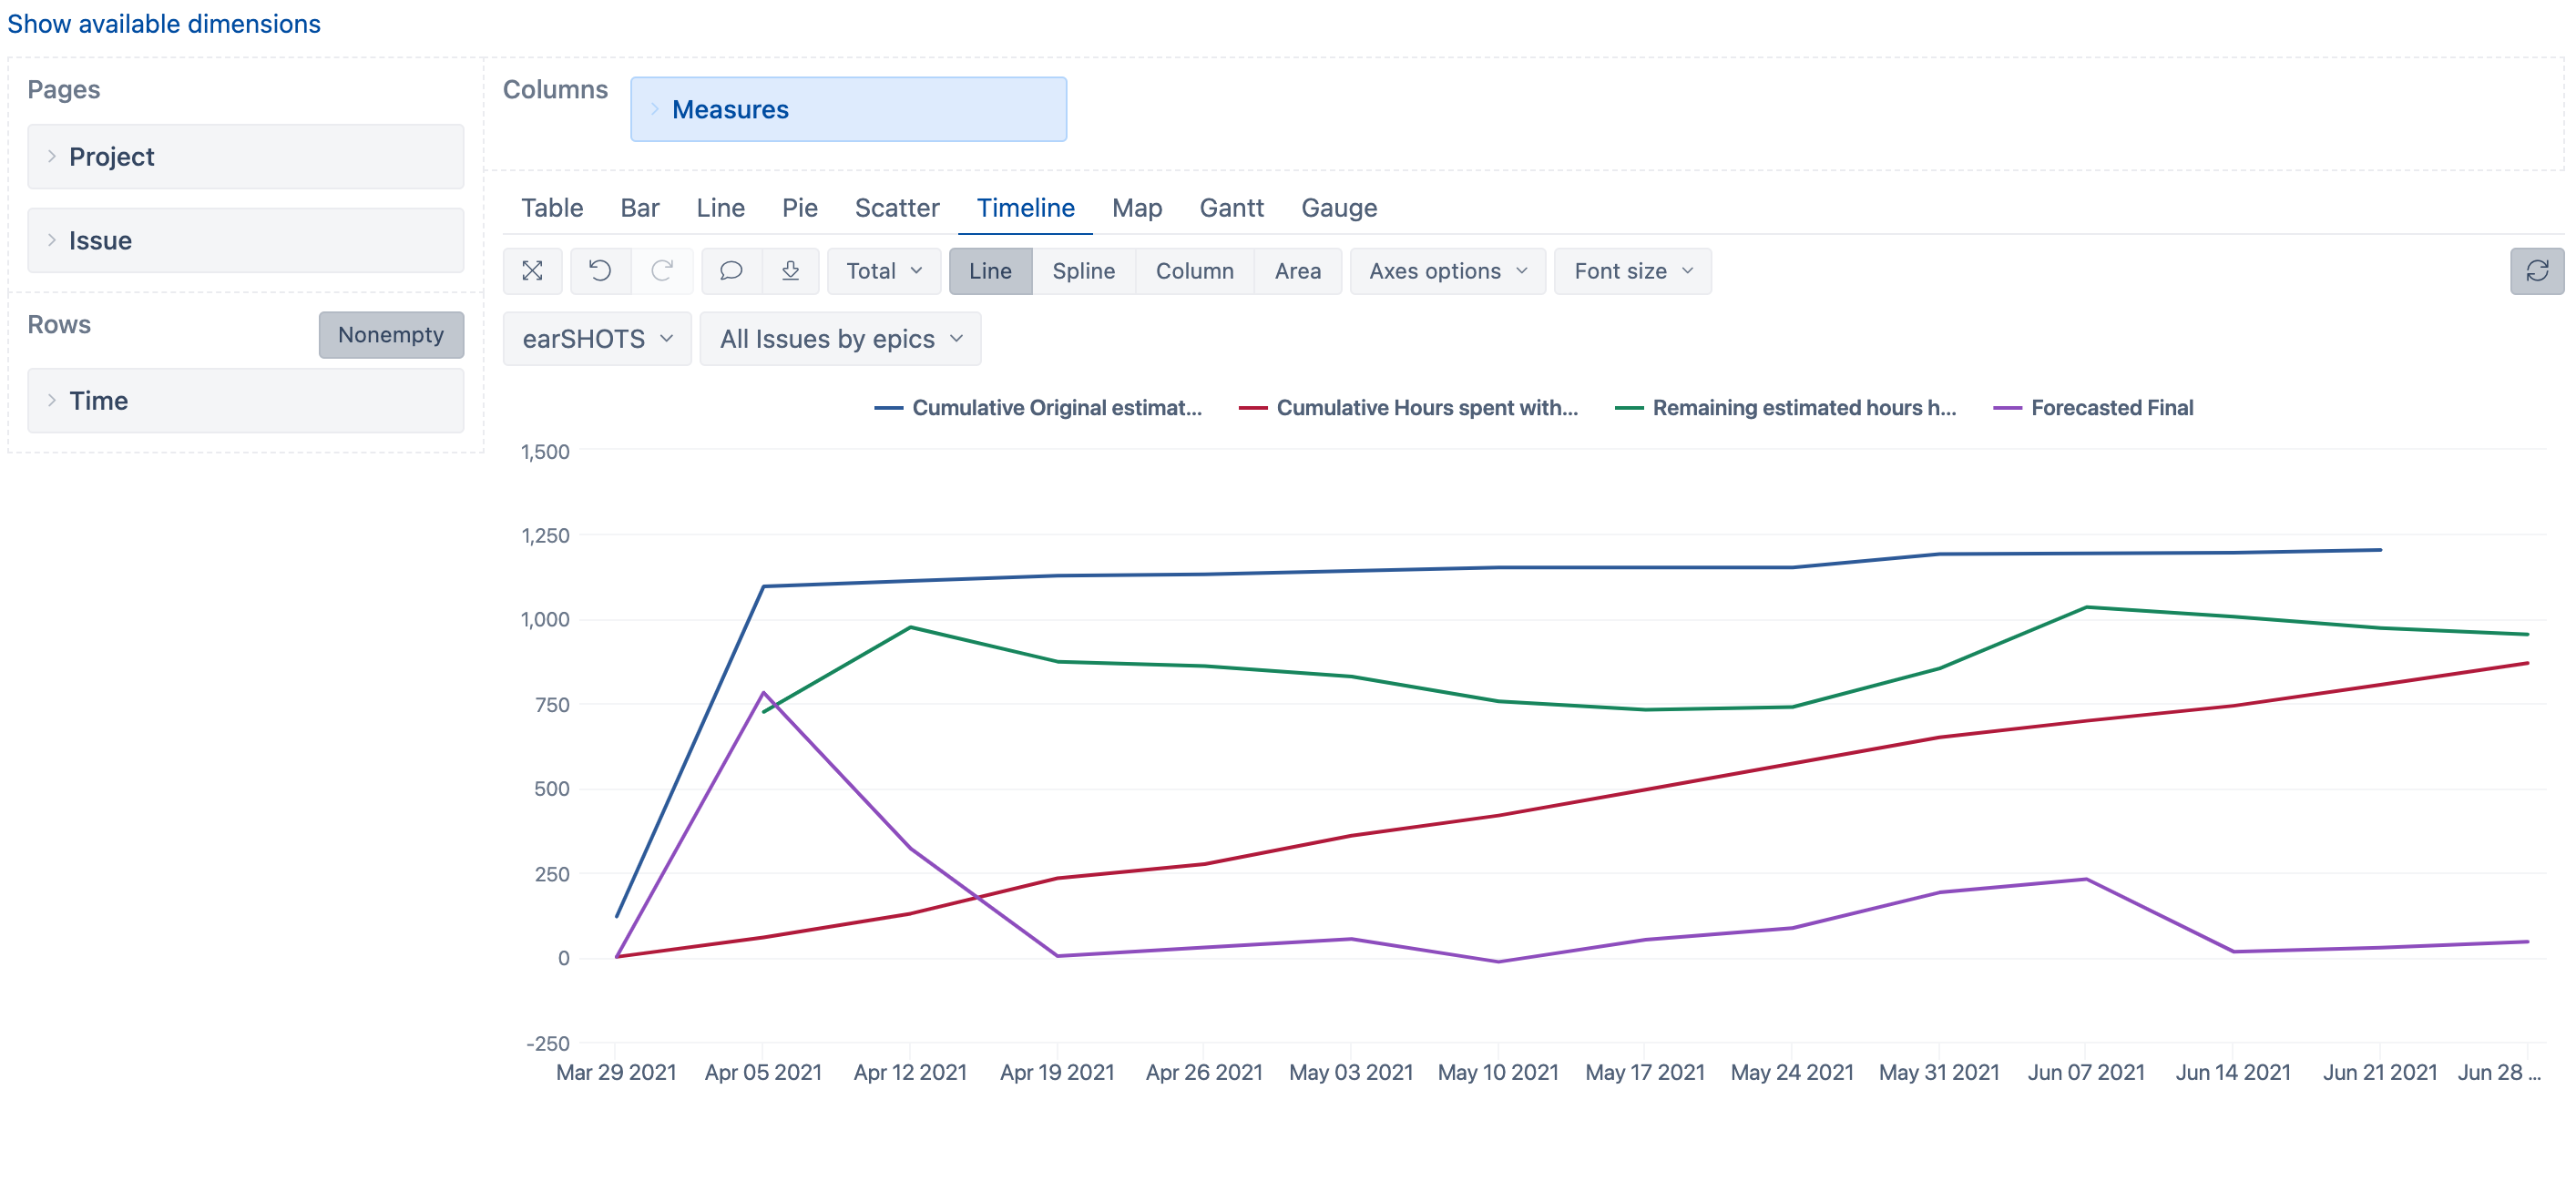
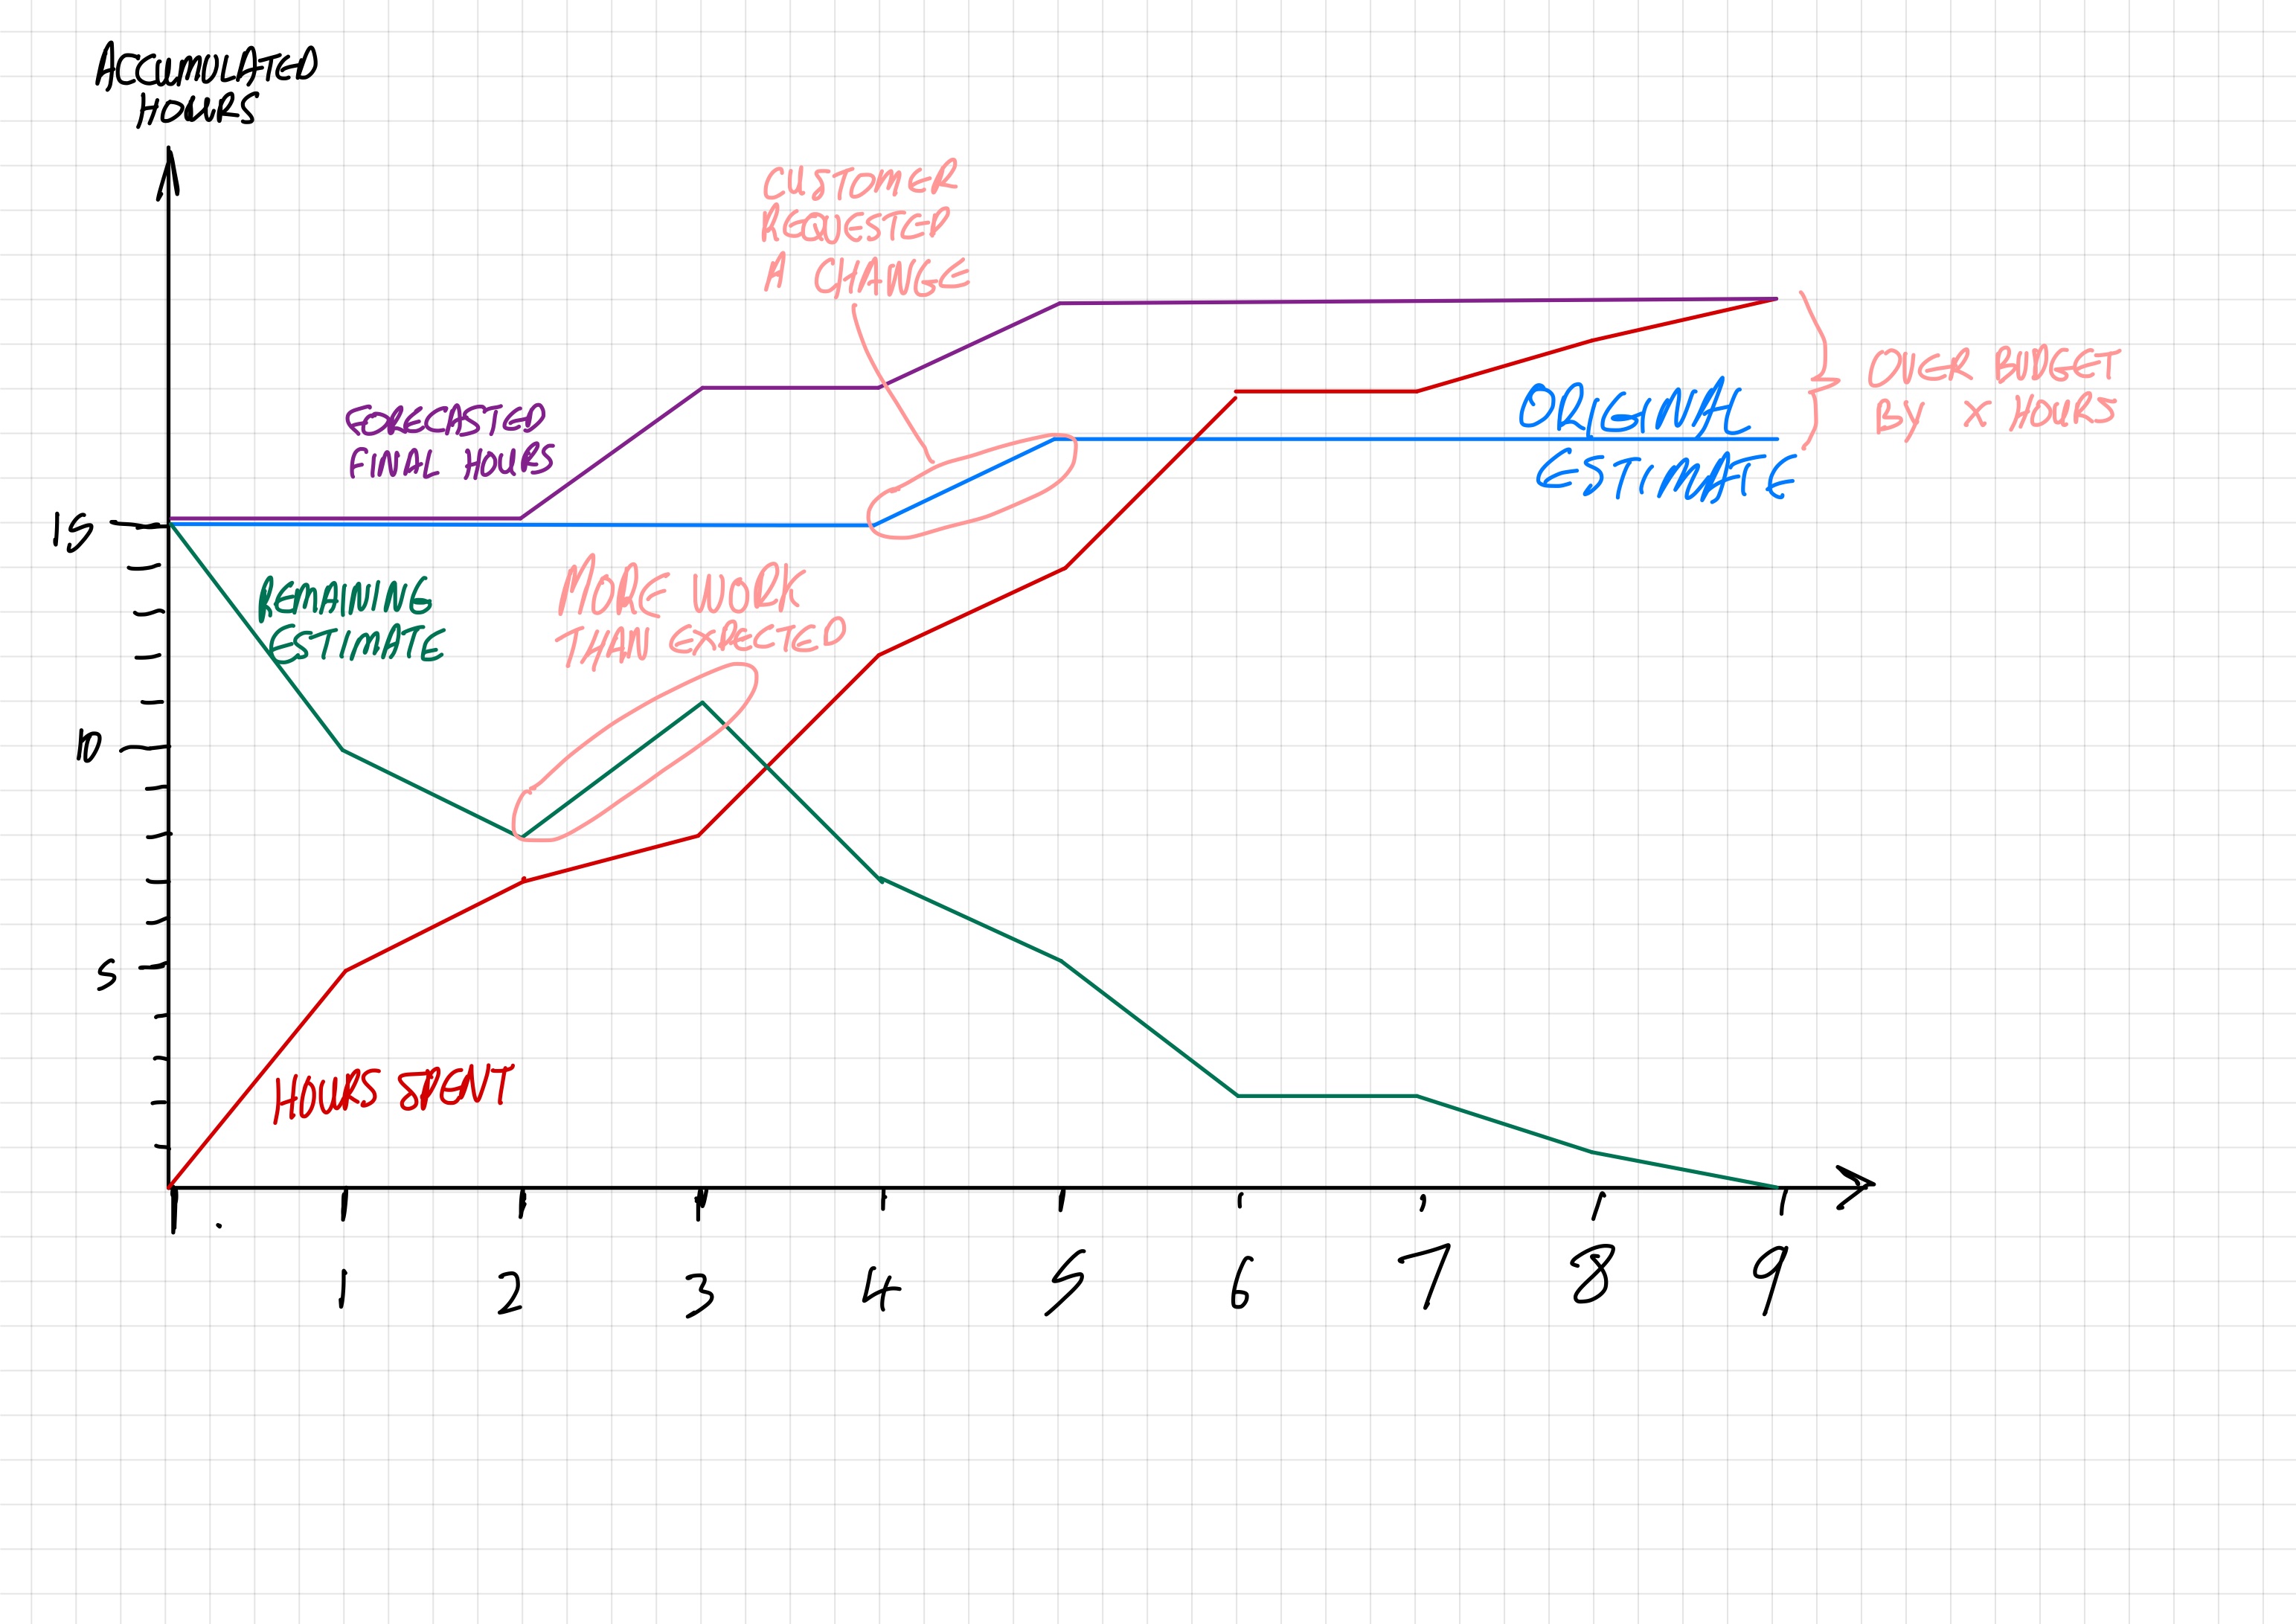
What I would like to do is create a line graph over time (week by week over the project) showing the accumulated original estimates hours by each epic, the accumulated hours spent by each epic, the accumulated remaining hours and hours spent by each epic, the forecasted final hours.
I’ve attached a drawing of what I’m wanting to create based on the data from Jira and Tempo.
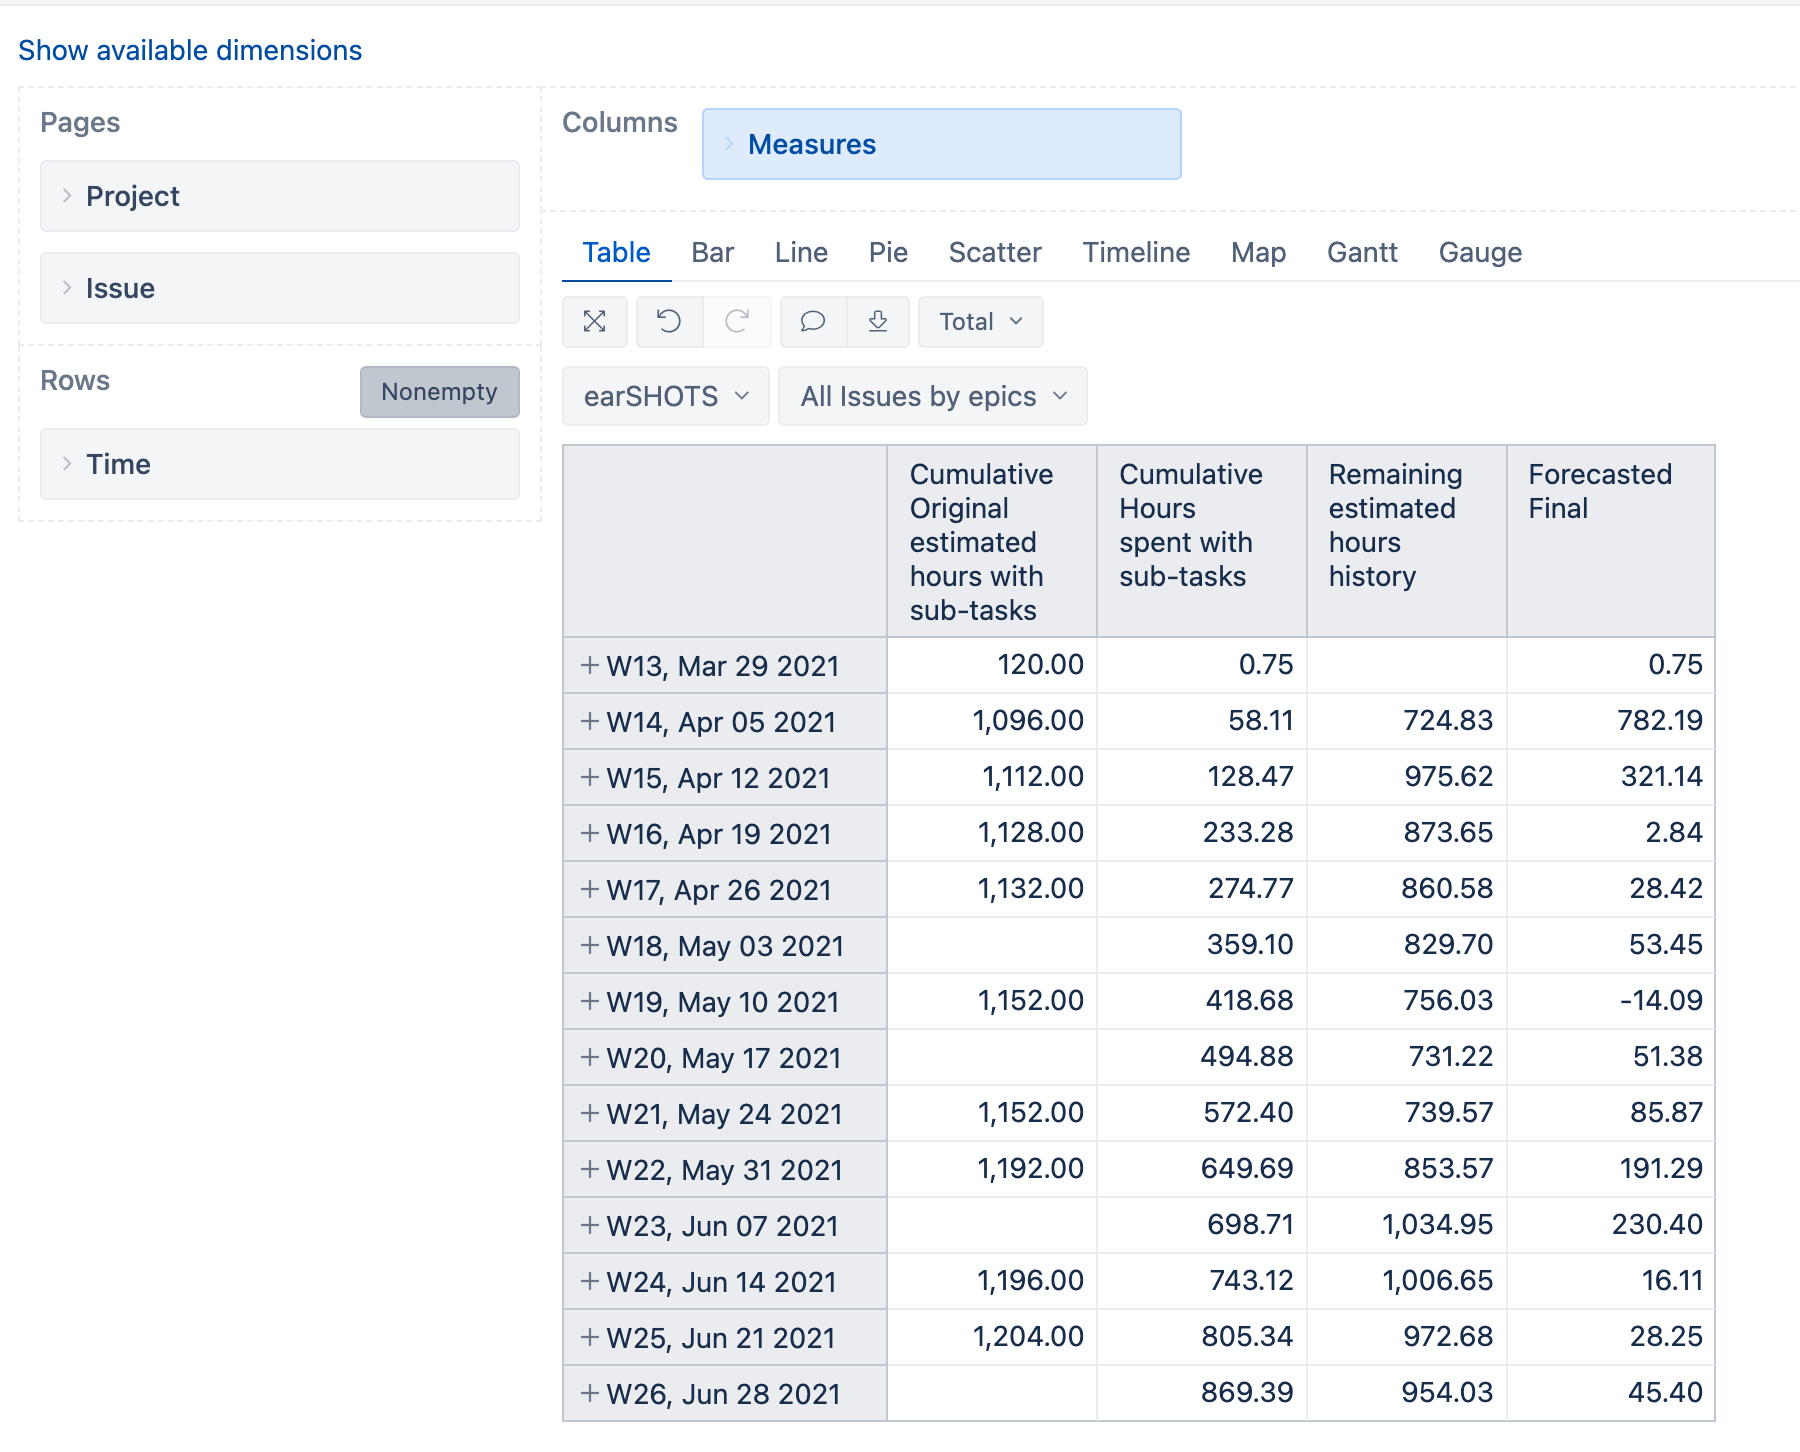
My last hurdle is calculating the final estimate which is a sum of the column: Cumulative Hours spent with subtasks and Remaining estimated hours history using a calculated measure:
[Measures].[ Forecasted Final ] =
[Measures].[Hours spent with sub-tasks] +
[Measures].[Remaining estimated hours change]
But it needs to be of the Cumulative Hours spent with subtasks - I’m not sure how to do this in a calculated member formula.
I know I’m close, but I’d appreciate it if someone can point me in the right direction so I don’t spend another couple of hours working it out.
Thanks
David