Hi there!
My company is doing a trial of eazyBI and we are very excited with the custom dashboads
I’m trying to build this table here:
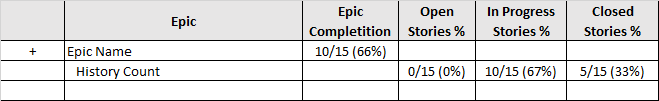
It is a little advanced for a newbee like me. May anyone help me to understand (in a stepwise approach…) how to implement it?
Thanks a lot!!!
Best Julio
Hi @JulioOliveira
I would suggest creating a stacked bar chart where the % calculation of epic stories in different statuses is an out-of-the-box solution, as well as it allows displaying both, the number of issues and the percentage together.
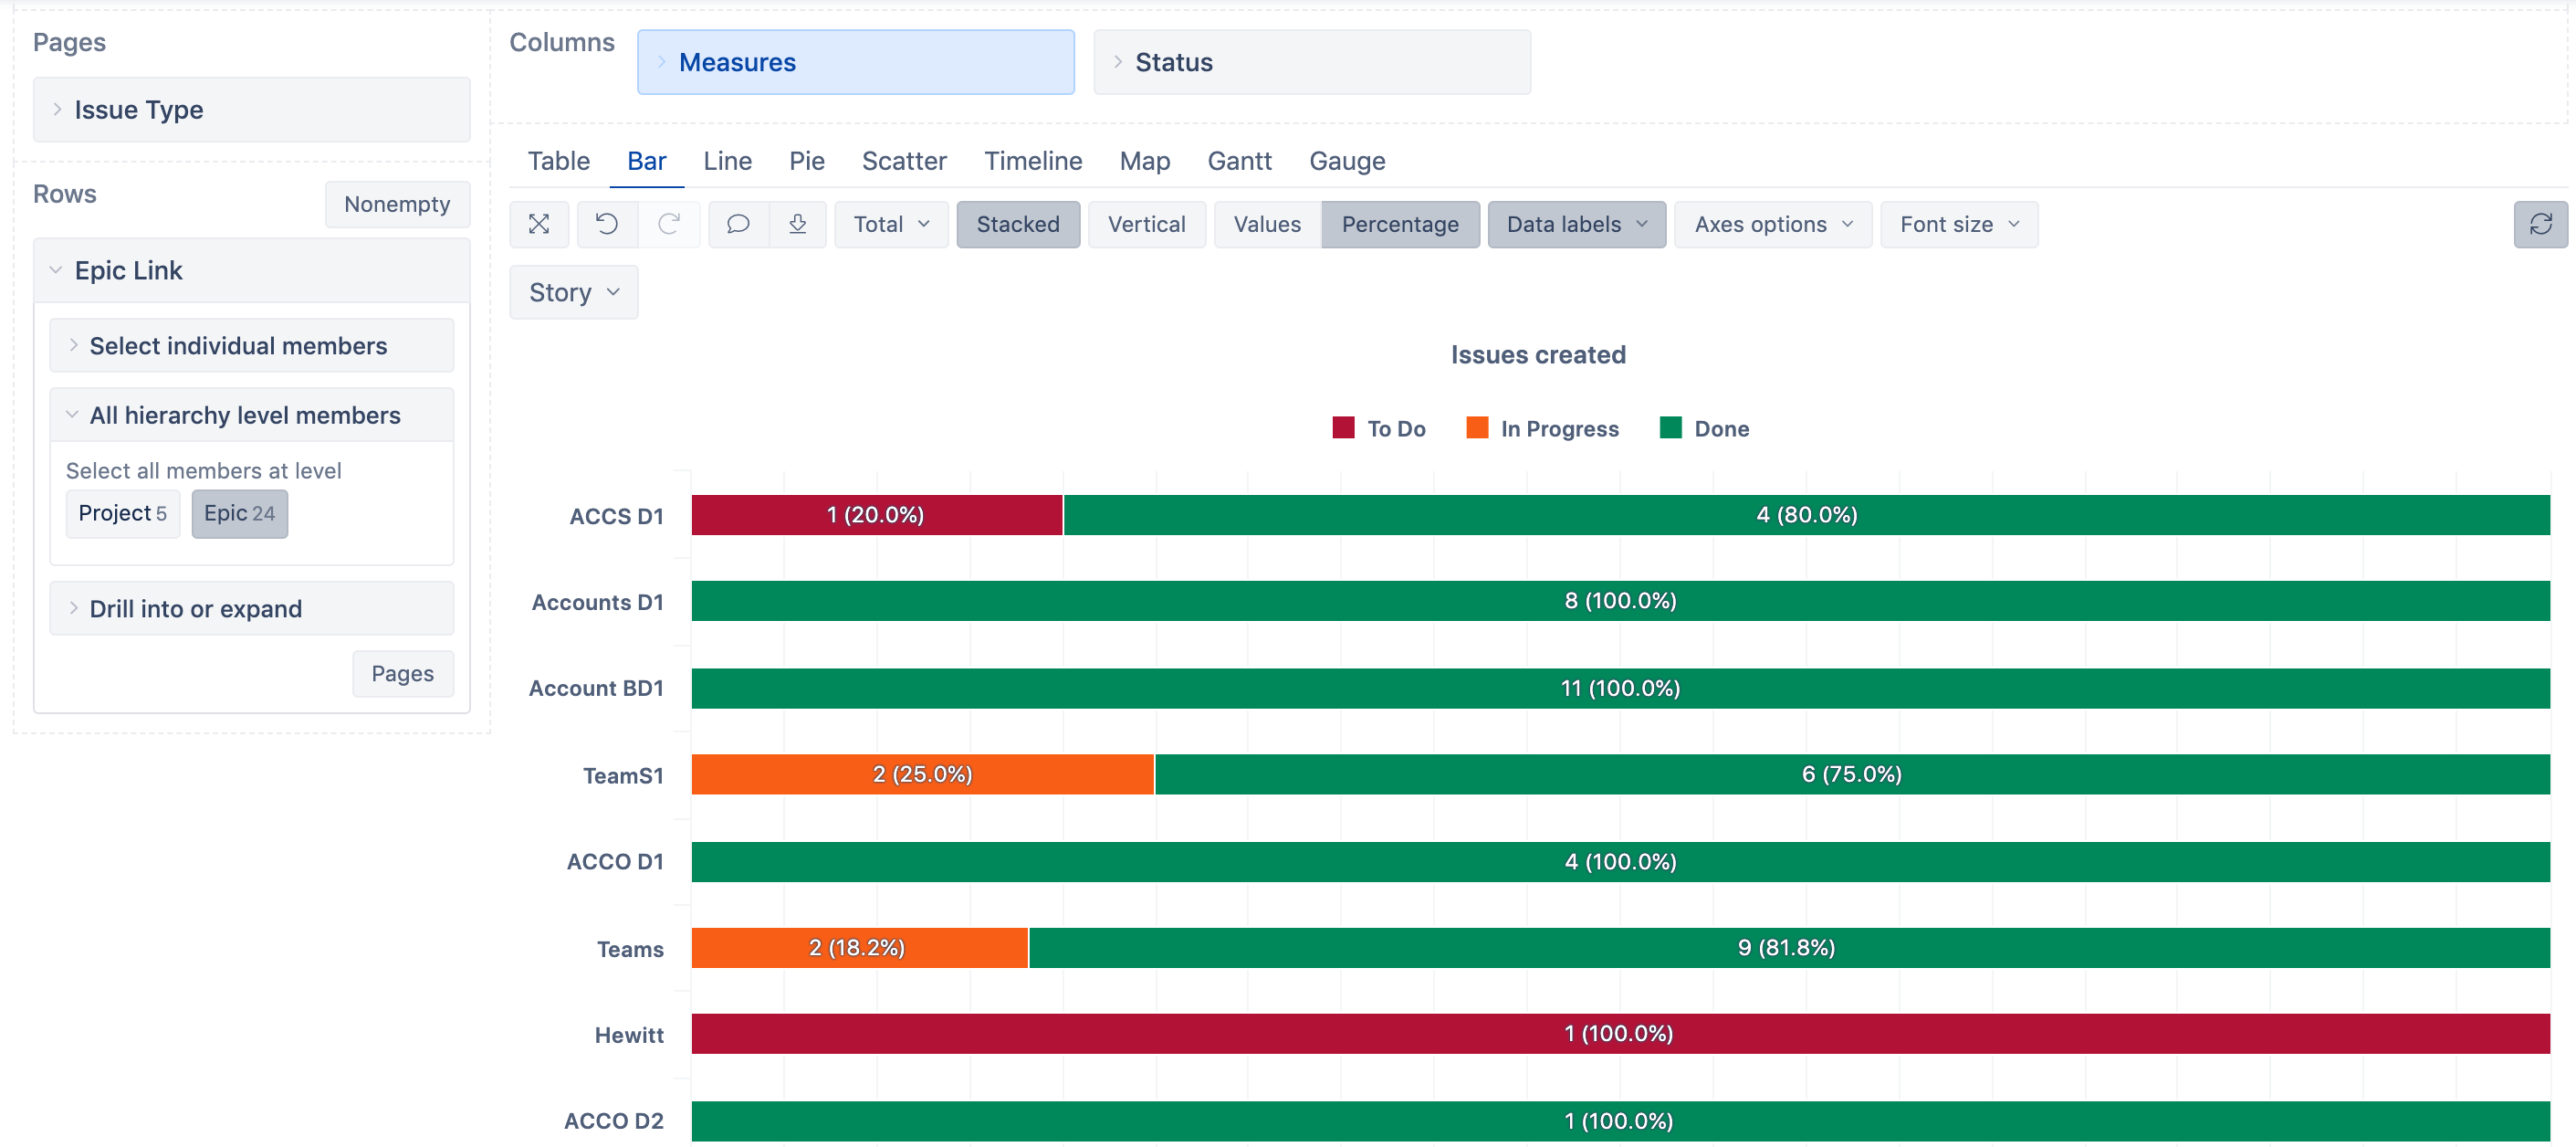
Create a report with Epic Link dimension Epics in the report rows.
Select measure "Issues created" and Status dimension Status categories in the columns.
Add, in Pages, Issue type = Story, if you went to include only stories in the report.
Switch to the Bar chart, use options Stacked and Percentage, and display Data labels for numerical and percentage values:
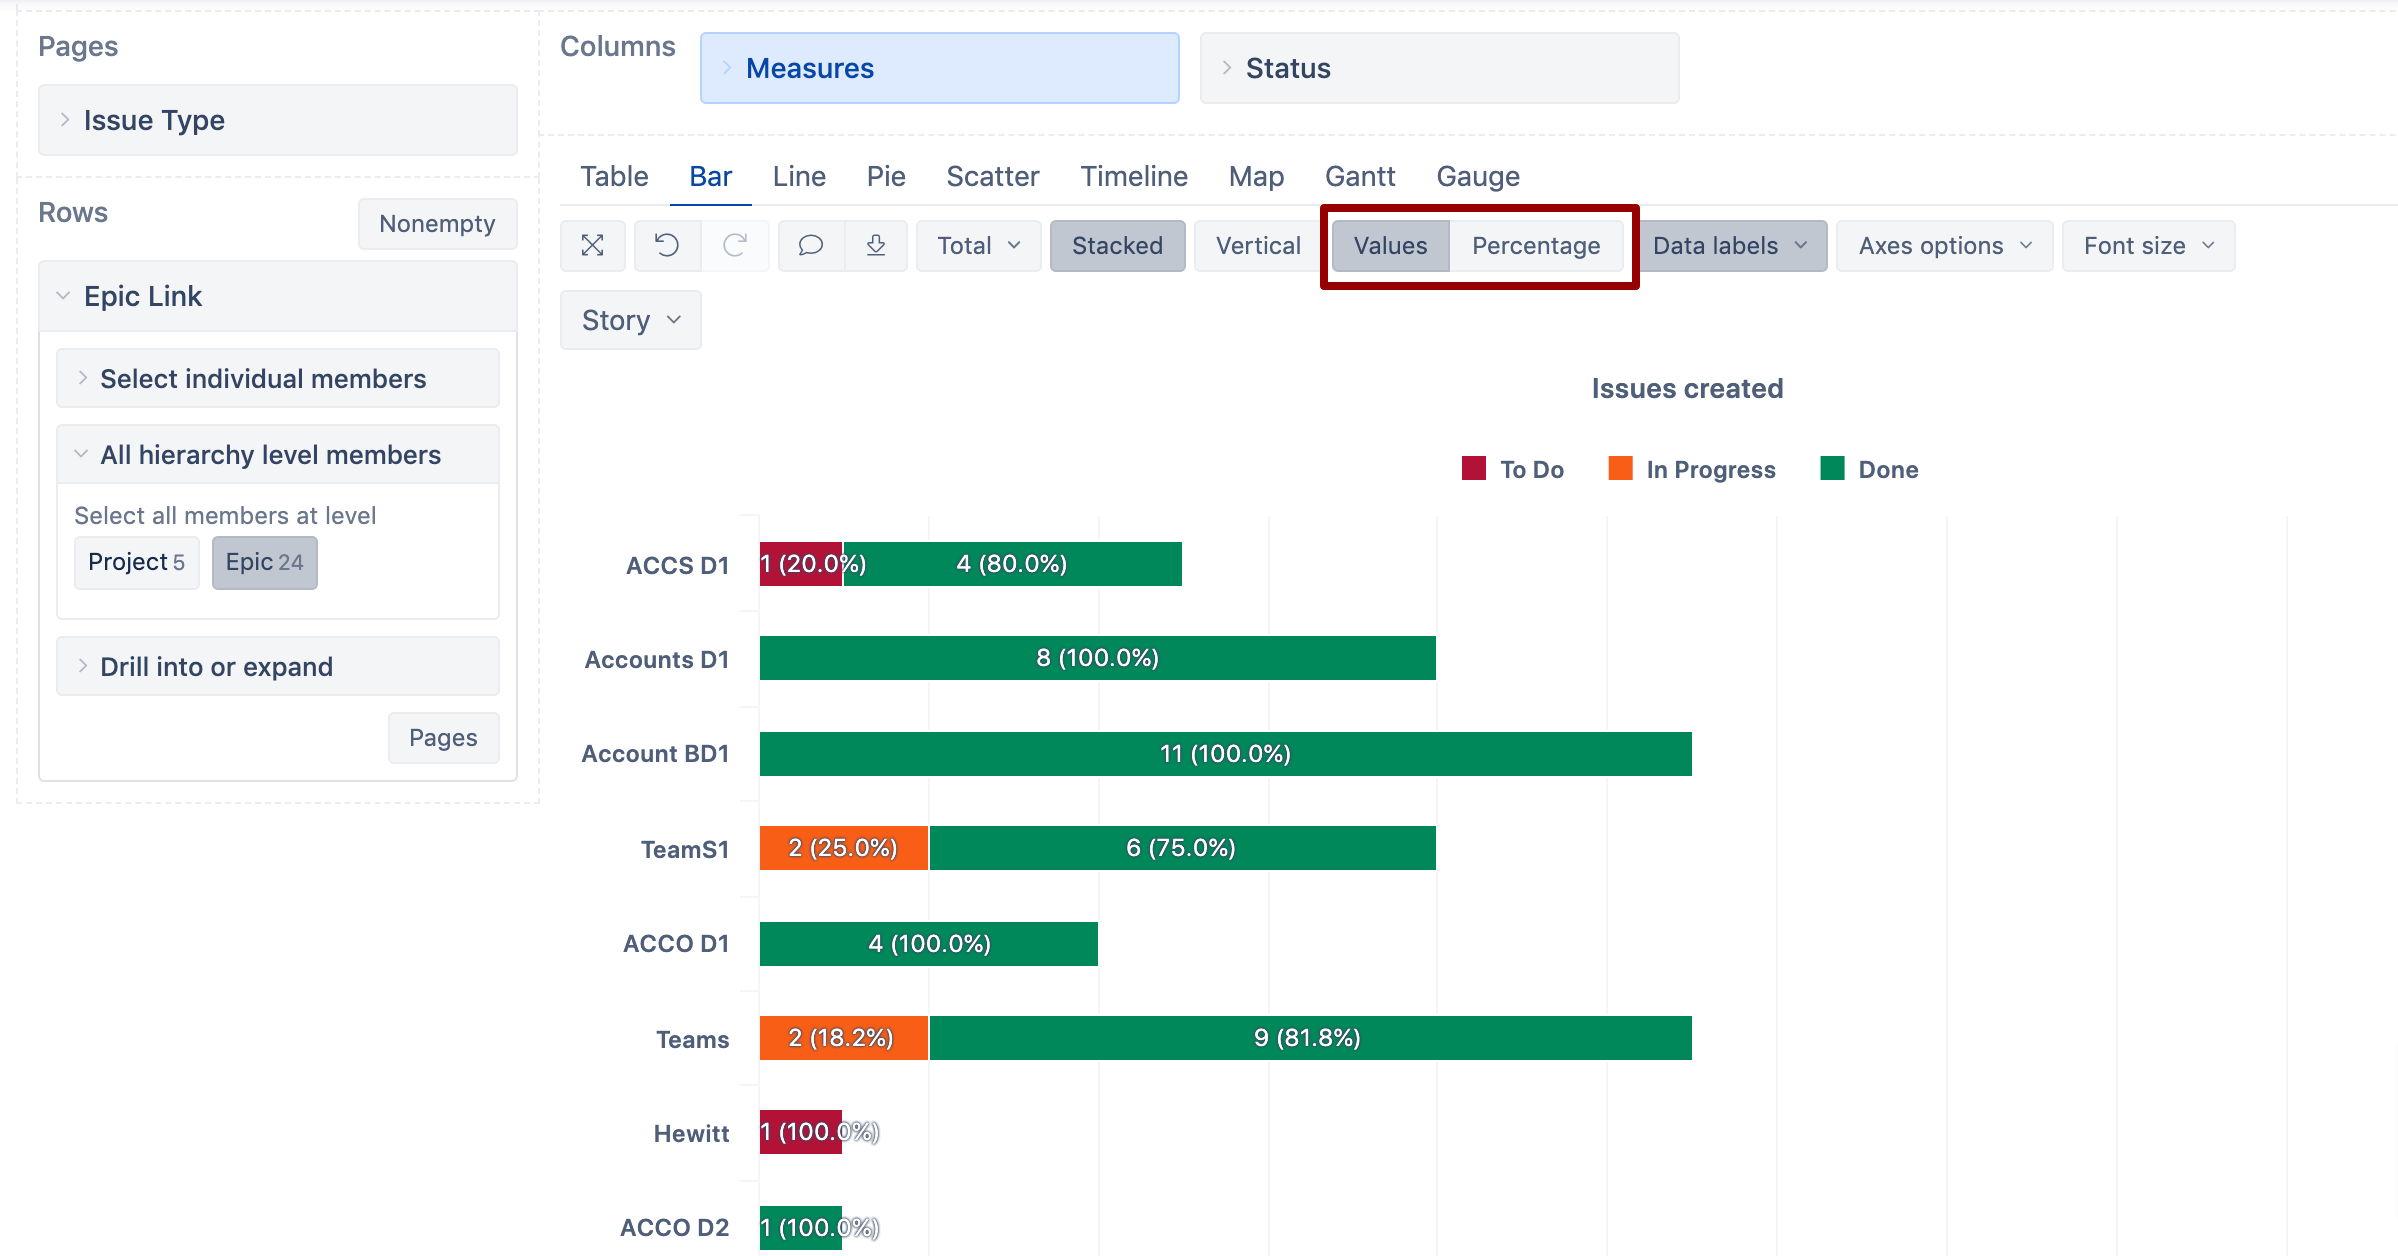
You may use Value instead of “Percentage”, if you want.to emphasize the number of issues in the epic rather than the relative progress of the epic. Below is the same report with changed display option:
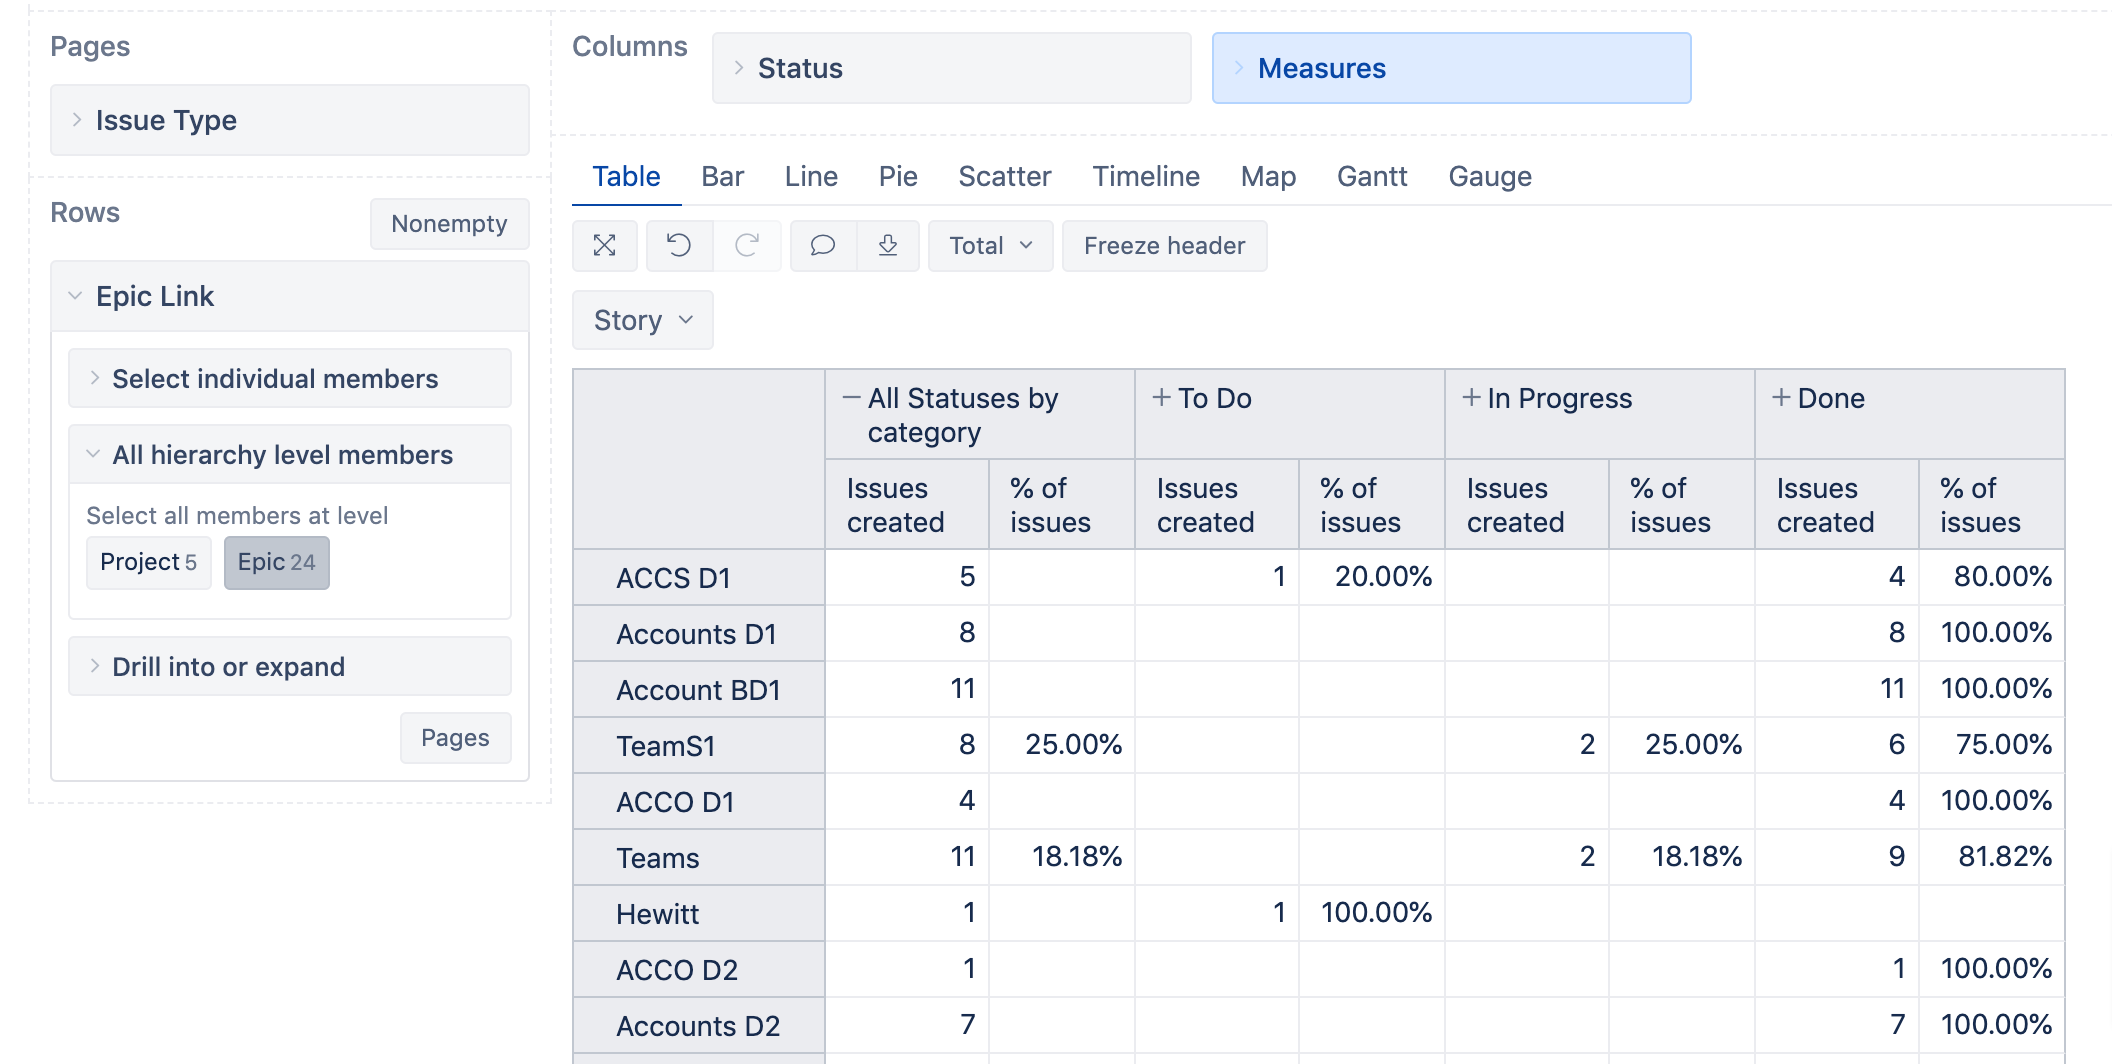
Otherwise, if you prefer to see the values in the table, you may want to create a new calculated measure (in Measures) to calculate the % of issues in each status and the % of issues “In Progress” category for total issues count per epic:
--condition to avoid dividing by zero
case when ([Measures].[Issues created], [Status].CurrentHierarchy.DefaultMember)>0
then
 CASE WHEN
  [Status].CurrentHierarchyMember is [Status].CurrentHierarchy.DefaultMember
 THEN
 -- for the All Status categories, % of issues in "In Progress"  is caluated
   ([Measures].[Issues created], [Status.Category].[In Progress])
   /
   ([Measures].[Issues created], [Status].CurrentHierarchy.DefaultMember)
 ELSE
--for any selected status /category the % in this status/categroy is calculated
 [Measures].[Issues created]
 /
 ([Measures].[Issues created], [Status].CurrentHierarchy.DefaultMember)
 END
end
Add this measure together with “Issues created” in the table columns. Below is the same report (data) as in the reports above.
Best,
Ilze, support@eazybi.com
Hi Ilze!
Thank you a lot… It worked perfectly!! 
Best
2 Likes
I am interested in this eazyBI report. Can this report be modify to use the current Sprint within a Project for the current progress of the Sprint?