Hello,
I been trying to create a table where I can see the teams capacity by hours. Just like this image shows I have each project team and then every fix version.
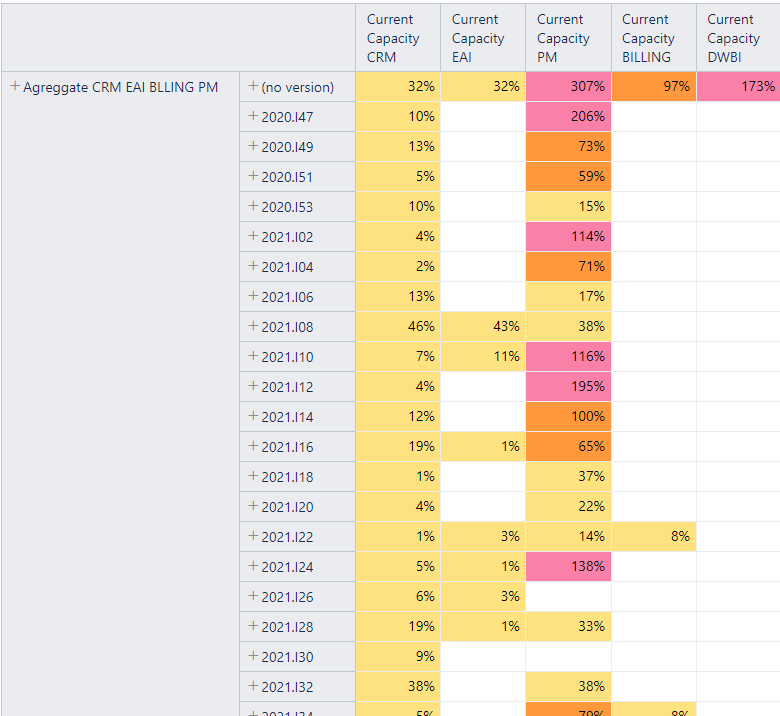
Right now the way I’m calculating it by using this formula, where the Capacity per iteration (hours) is another calculated measure where I multiply the number of member on that team by the number of hours per iteration (80 - 8 hour per day) by 0.80 (which is the utilization rate).
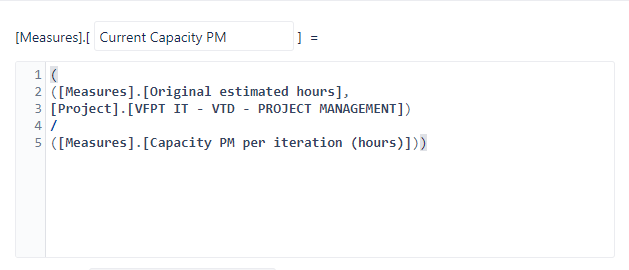
My question/problem is that some issues have more than one fix version which means that the original estimated hours will appear for both versions and that wont give accurate results i dont think. for example if one the first version i did 5 hours on a 20 hour estimated issue on the second fix version i would only want to appear 15 i think.
If anyone could help me i would aprecciate it!
Thanks in Advance