Hey guys,
is there a way to display the XRAY Custom field “TestRunStatus” in EazyBI?
The sample testRunStatus report uses the Execution Status. But Xray itself has a calculated field named TestRunStatus where the final Status of a TestRun is displayed, regardless of it’s Execution.
Thank you in advance 
Best regards,
Anna
Hi,I am having a similar kind of requirement where I need to generate a graph in EazyBI on ‘Last Run status’ of each XRAY test…i.e. GroupBy ‘TestRunStatus’…
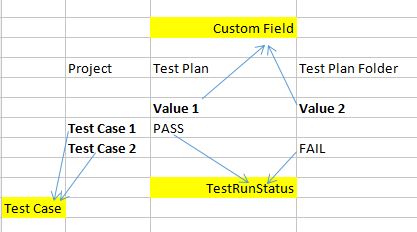
Example ::
There are 100 tests in scope
Final ‘TestRunStatus’ is 50 Pass & 50 Fail irrespective each test is executed n number of times.
How do I represent this in EazyBI
Hi,
This is really very urgent. Any help much appreciated.
I am able to pull out ‘last execution status’ of each test but unable to COUNT the number of Tests which has its last execution status as Pass/Fail etc.
Hi,
In eazyBI Jira import options, is a list of Jira custom fields with standard data types. You can also add Xray specific custom fields for data import.
-
In eazyBI advanced settings, add following lines to fetch the TestRunStatus values for data import:
[jira.customfield_NNNNN]
data_type = "string"
Replace NNNNN with the ID of the custom field TestRunStatus ID in your Jira.
-
In eazyBI Jira import options, select the TestRunStatus custom field for data import. And perform data import.
-
In the analyses new issue property Issue TestRunStatus is available for you. To get this property value for tests as well, define a new calculated measure in Measures.
[Xray Test].CurrentHierarchyMember.get('TestRunStatus')
Best,
Zane / support@eazyBI.com
Hi Zane,
Thanks a lot for this reply. I will try to implement this and will get back to you.
Hi Zane,
Thank you very much 
Could you also explain how to use the Custom field for example in a Pie Chart? Is there a way to do so? (I am a little bit confused because the TestRun Status is not a Dimension, so I am not shure on how to handle it properly.)
Best regards,
Anna
To create a Pie chart, you need some numbers, like a count of tests for each custom field “TestRunStatus” value.
This is what you may do.
-
First, you may import the custom field as dimensions as well. Add one more line to advanced settings like this:
[jira.customfield_NNNNN]
data_type = "string"
dimension = true
-
Then select custom field for data import as a property and as a dimension. And import data.
-
New dimension TestRunStatus by default won’t work with Xray specific measures as eazyBI relates all imported custom fields to Jira issues and measures for Jira core functionality, like, Issues created.
To make new dimension TestRunStatus work with data from Xray, you may define a new calculated measure “Test count by TestRunStatus”.
CASE WHEN
  [TestRunStatus].CurrentMember.Level.Name = 'TestRunStatus'
THEN
  NonZero(Count(
    Filter(
      --iterate through all created tests
      Descendants([Xray Test].CurrentHierarchyMember, [Xray Test].[Test]),
      --which have TestRunStatus value the same as selected TestRunStatus member
      CoalesceEmpty([Xray Test].CurrentHierarchyMember.get('TestRunStatus'),"")
        MATCHES [TestRunStatus].CurrentMember.Name
      AND [Measures].[Xray Tests created] > 0)
  ))
END
Best,
Zane / support@eazyBI.com
How to Create Report having Xray Test Custom field in column, Xray Test in Row and TestRunStatus in Cell.
Recently eazyBI released a new version 6.6, which includes several improvements for Xray data analysis, including new properties representing “TestRunStatus” as it is calculated on the Test issue.
For more details, please see the documentation: Xray Test Management
Best,
Zane / support@eazyBI.com