The steps as below:
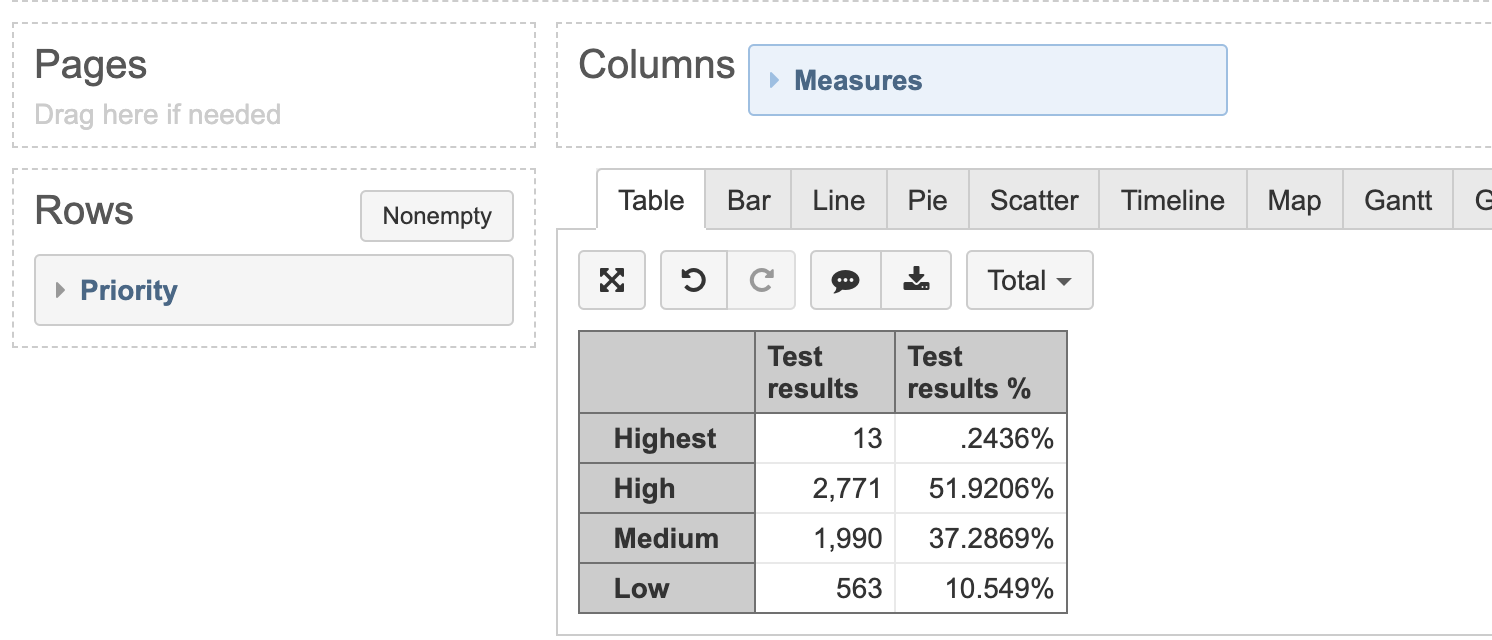
- In table view, I got the correct values for percent of total.
- Removed percent values from table view.
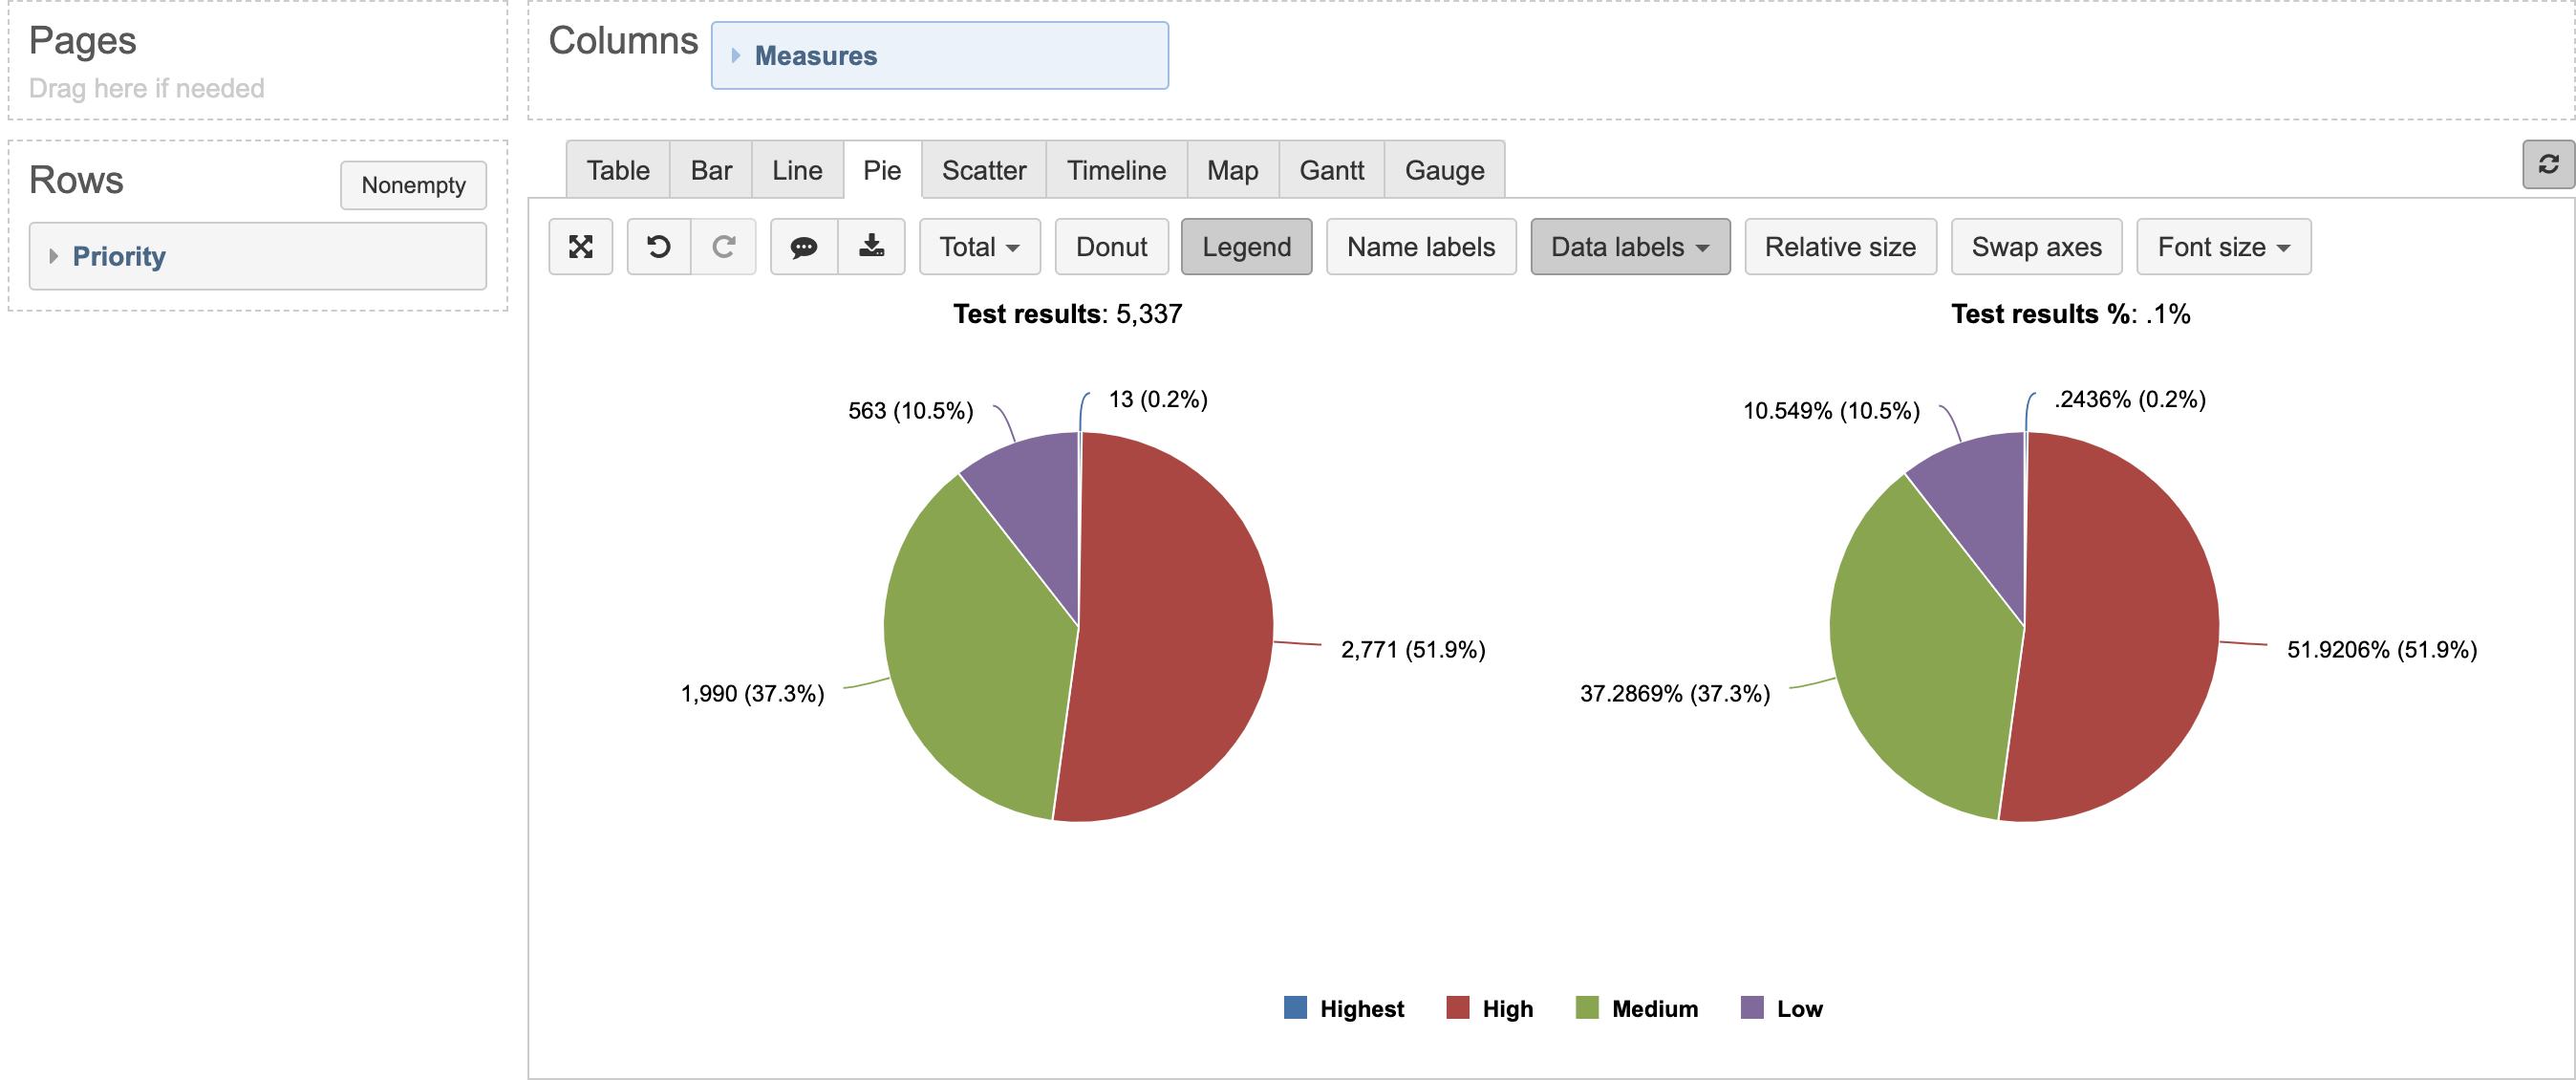
- Go to pie view, select data label “Values and percentage”. then it shows the total percent less than 100%.
More details, please refer to attachments. How to make it show to us correctly?
please help to check and revert to me, Thanks
Best Regards
Annie Gao
Hi Annie,
This seems like a rounding issue where a percentage label for value 10.55 in Pie chart in your report is displayed with only one decimal digit and rounded to 10.5 (instead of 10.6).
Can you please export and share the report definition so we can check how exactly the calculation in the secondary column was created in your example?
Martins / eazyBI support
Hi Martins,
Please refer to below details for measures.
the report is:
the ‘risk level’ dimension(was imported from data source) on row
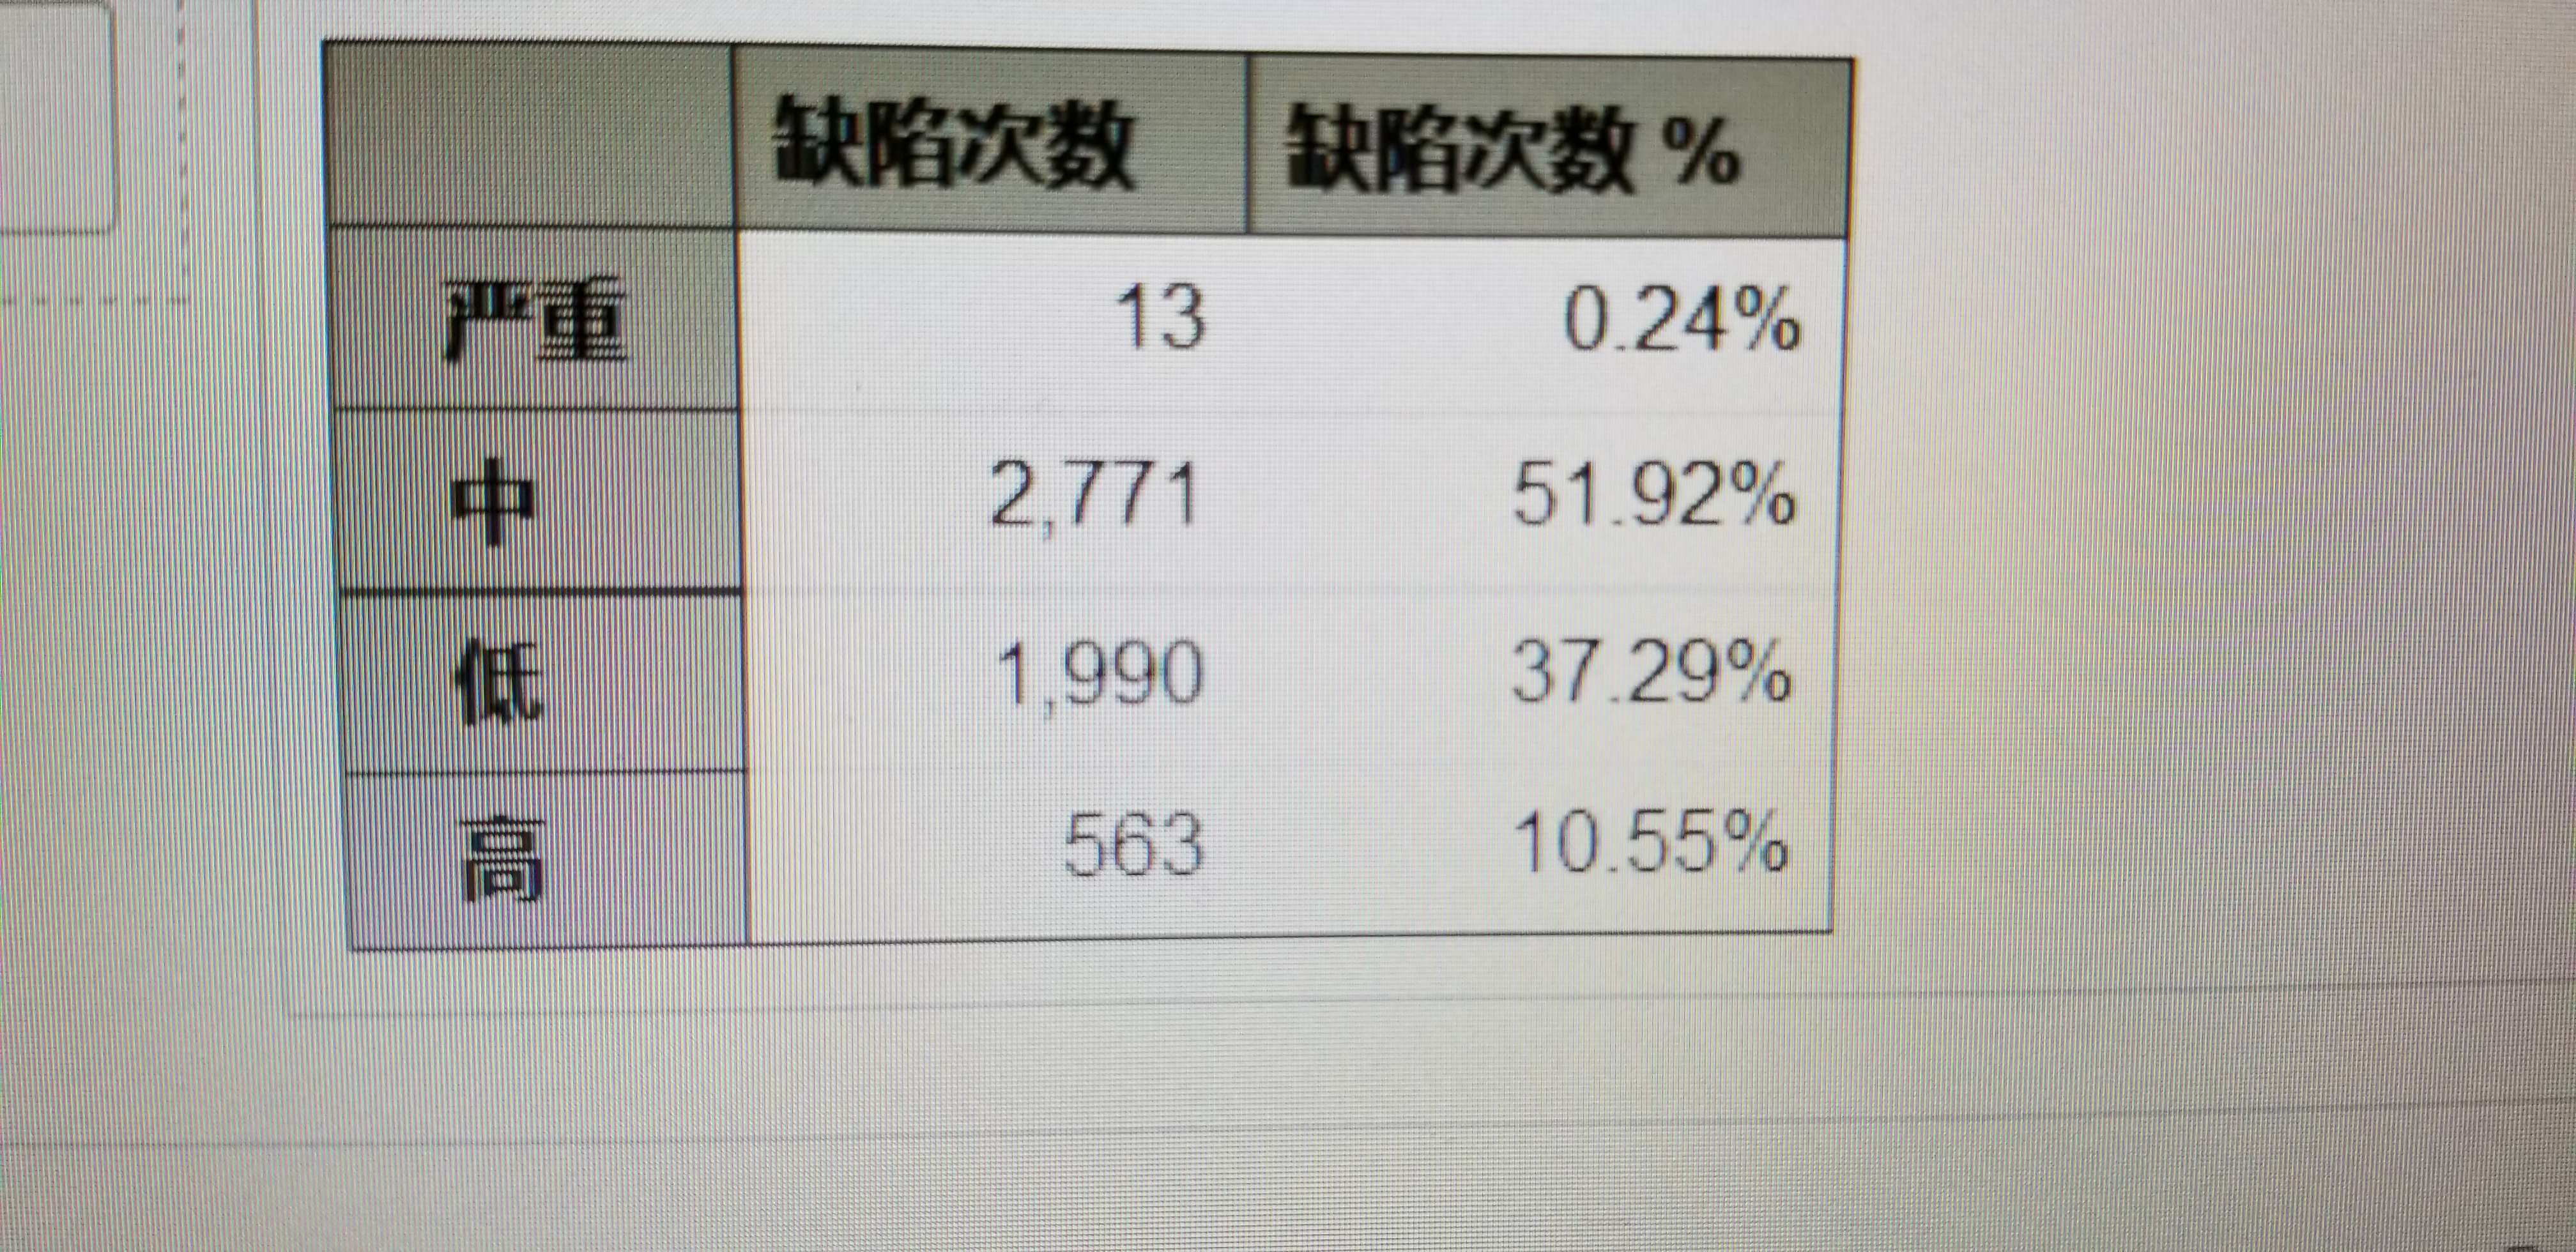
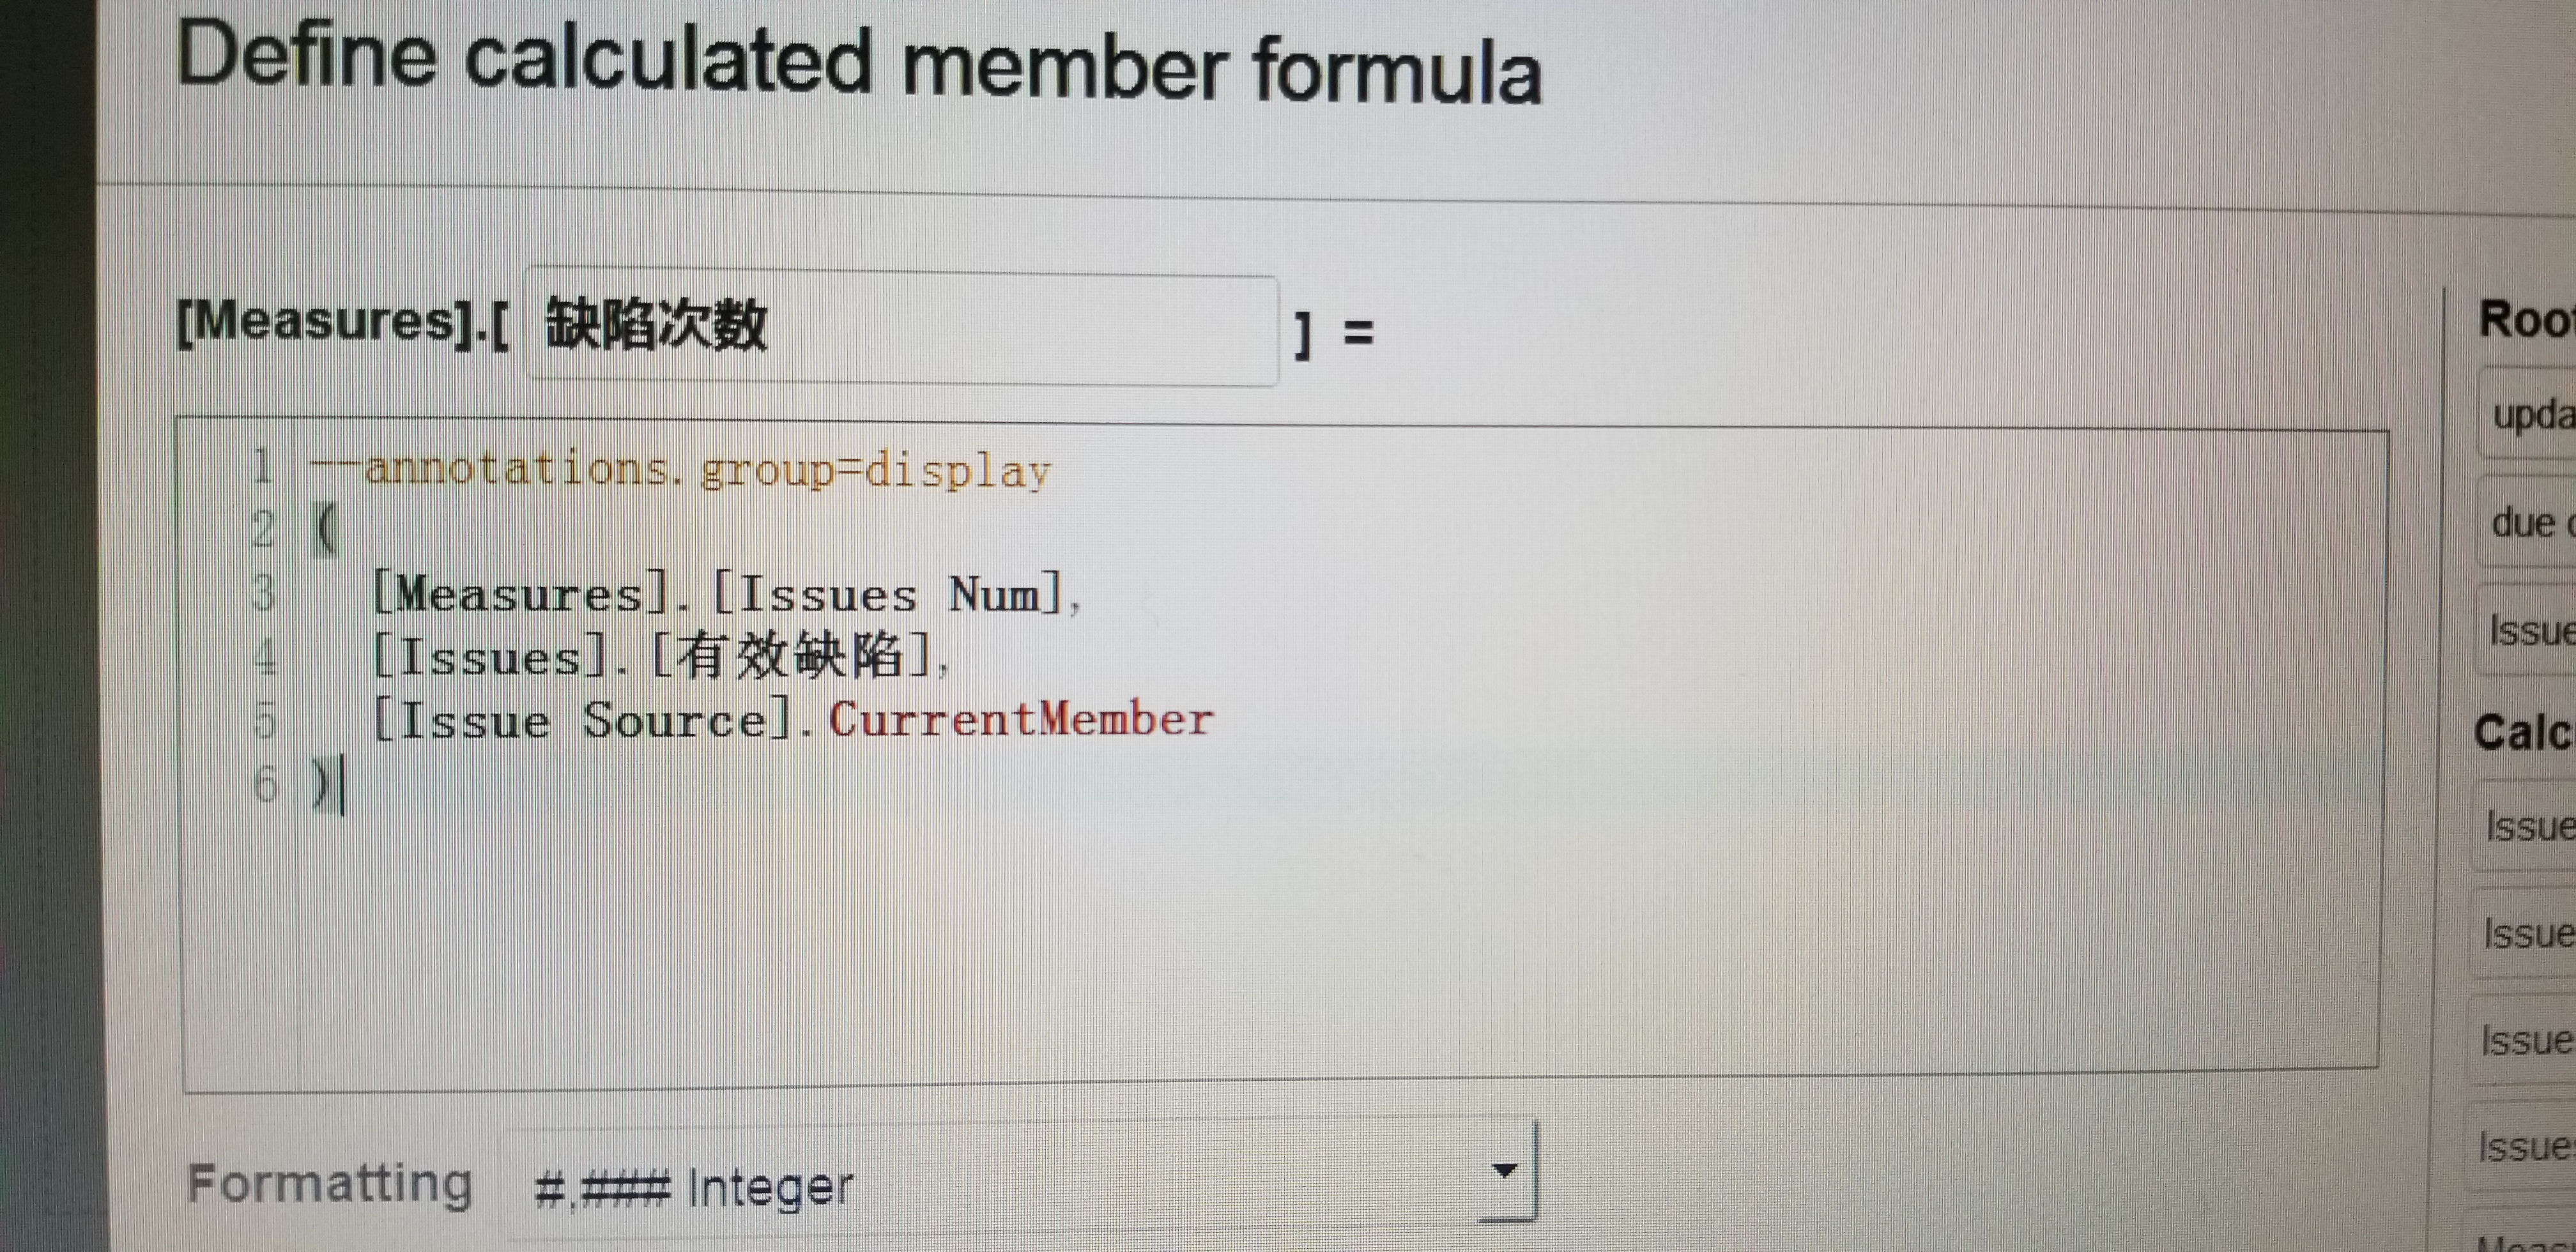
the ‘缺陷次数’ measure on colume.
please let me know if you need more information, Thanks
Best Regards
Annie Gao
Hi,
Could you share more details about the measure “Issues Num” that is used in one of your formulas (in screenshots)?
How exactly did you import it and what is the field in Jira that holds that information?
Martins
Hi Martins,
We use sql source application to import all data, not jira.
This “Issue Num” is one measure which was defined during data import, just integer value.
please let me know what details are required?
Annie
Hi,
Thanks.
I was able to repeat this behavior on same data points.
This is a rounding issue.
If you would change the format for the “% of total” measure to 5 decimal digits in percentage calculation you would notice that the value is actually 10.549 which is displayed as 10.5 in pie chart (when only 1 decimal is shown).
However in the table report when you display just two decimal digits it appears rounded to second decimal therefore displayed as 10.55
See pictures attached.
Unfortunately, you can’t customize the format for percentage values in pie chart.
The only solution would be creating a separate pie chart which calculates the results in table and display these values as “values” (without percentage) in pie chart
See attached gif.
Martins / eazyBI support