Hey, everybody. I was requested to reply this Throughput Histogram.
It shows the number of work items completed on a day versus the number of days, and also the percentiles (95%, 50% and 85%) showing the potential certainty to resolve the issues in a certain amount of days.
It’s a report from a plugin called Actionable Agile.
Actually, I do get how to make the Percentile calculated member, but not really how it’s applied to this case. Also I do not get which dimension gives work items completed on a day.
Has anybody ever done something like that?
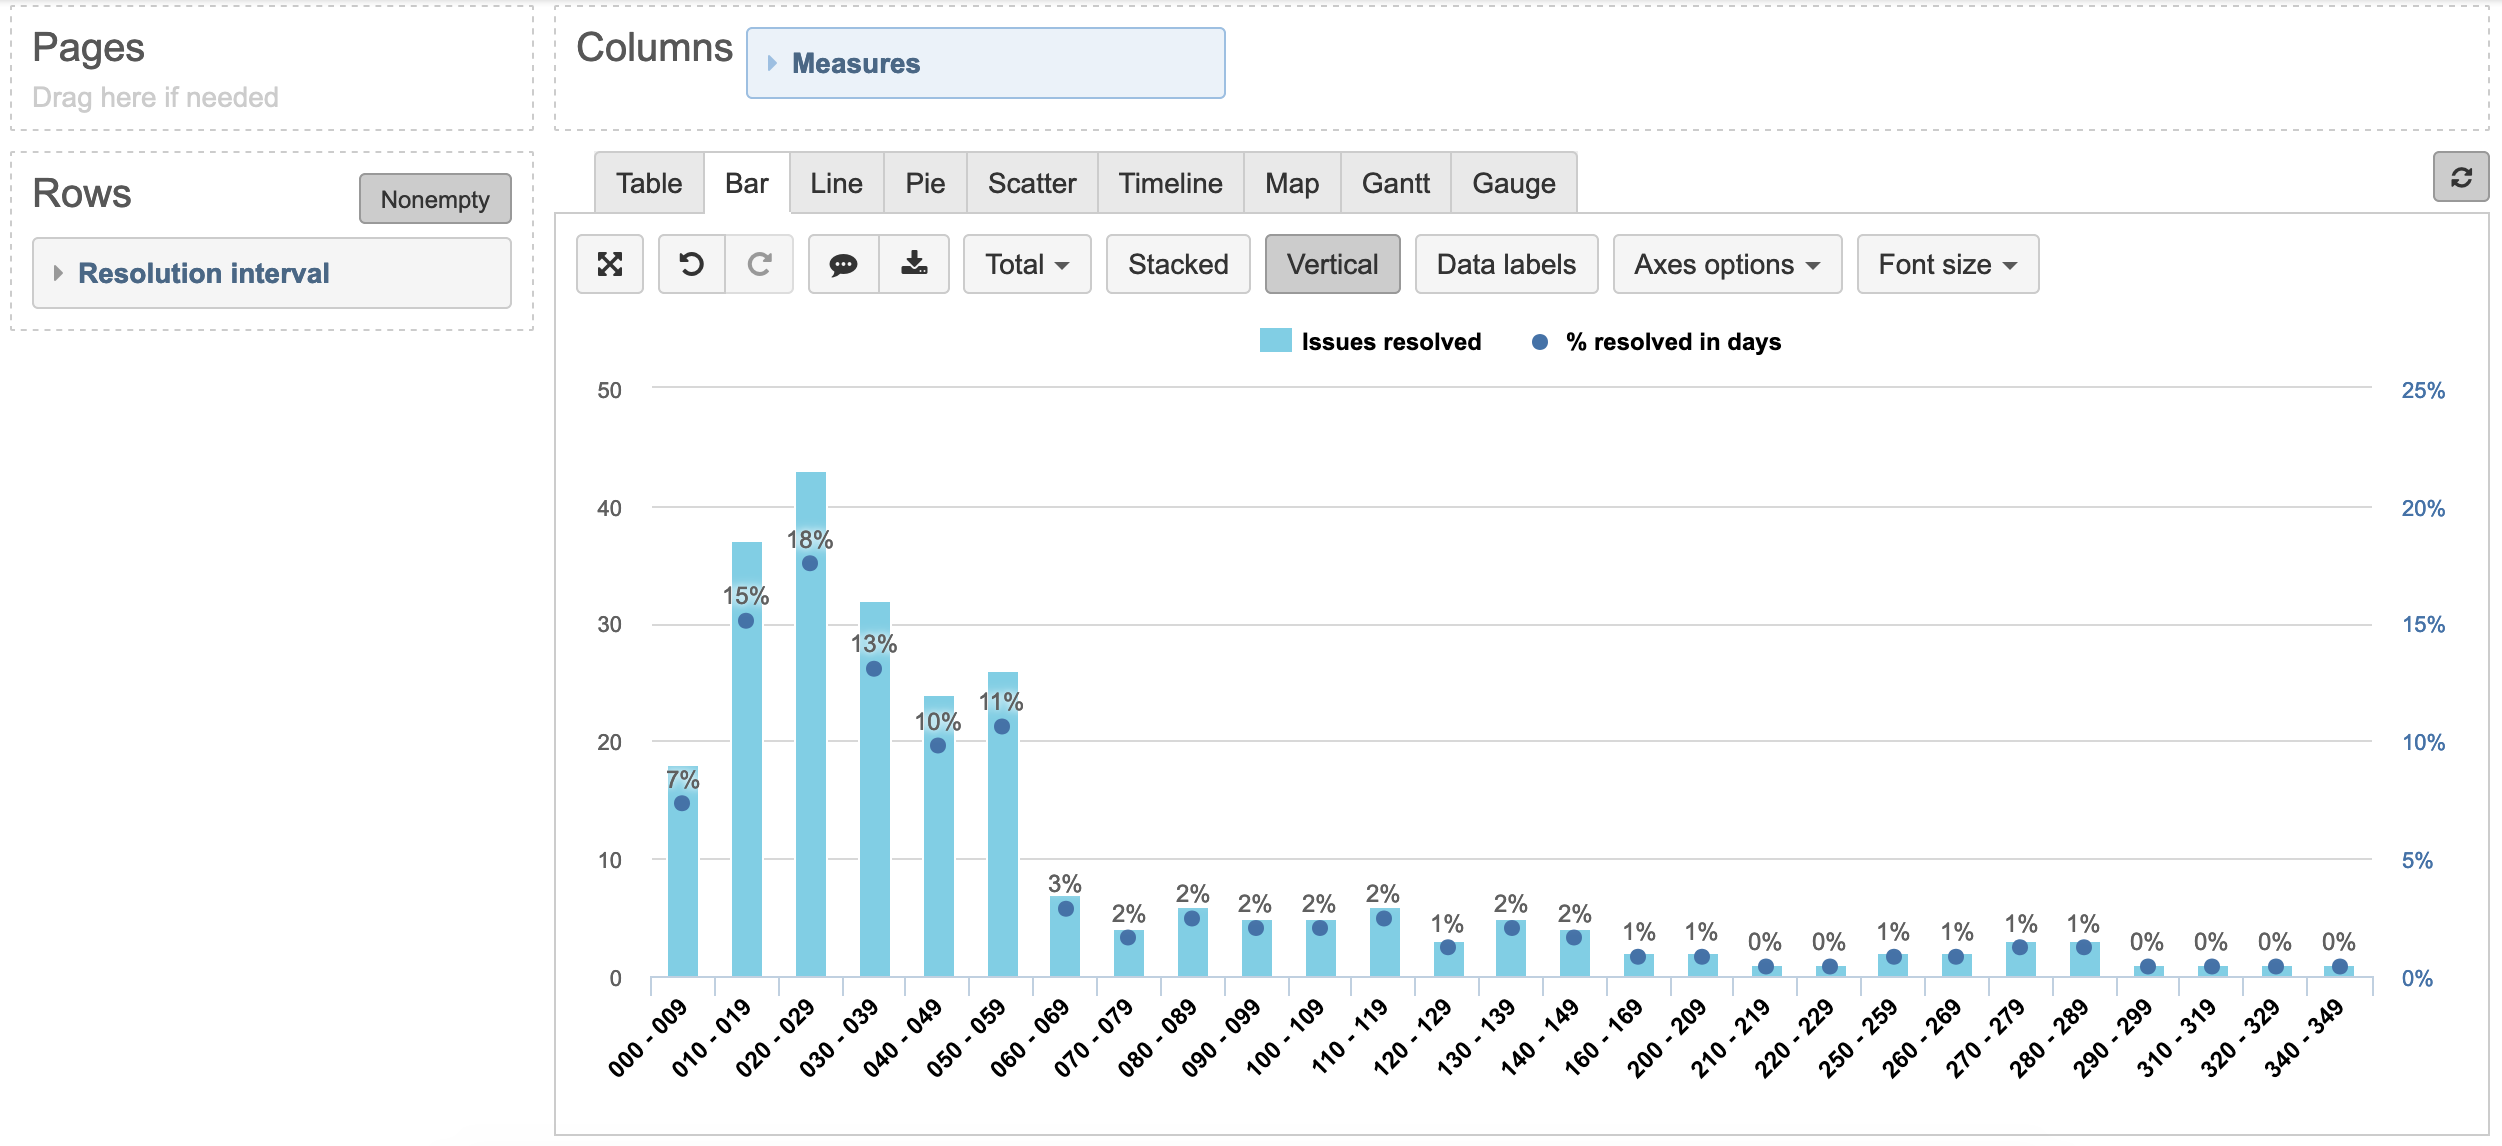
I would suggest using Resolution interval dimension to represent how many issues were resolved in a particular amount of days. This dimension is no default import option. You would like to select interval dimensions for import.
Then you would like to set intervals you would like to analyze.
For probability, you can use a calculation of % of issues resolved in this amount of days compared to total resolved issues. If necessary, you can apply more advanced percentage calculation.
resolved in days %:
CASE WHEN
   ([Measures].[Issues resolved], [Resolution interval].DefaultMember) > 0
THEN
   [Measures].[Issues resolved] /
   ([Measures].[Issues resolved], [Resolution interval].DefaultMember)
END
Here is a report example for this:
Daina / support@eazybi.com
What are the measures here?