I am trying to obtain the status of a ticket per day (taking the time that the sprint lasted as the interval), that is:
If the sprint started on April 5, 2022 with 3 tickets, for each ticket show me that they were in backlog status.
Then if on April 6, 2022 only one was moved to the in progress status that shows me (by name of the tickets) 3 in the backlog and 1 in progress
April 05 → Ticket 1 → Backlog
Ticket 2 → Backlog
Ticket 3 → Bakclog
April 06 → Ticket 1 → Backlog
Ticket 2 → Backlog
Ticket 3 → In Progress
In this case in the rows I would have Time and issue, while in the columns the measure I am looking for
eazyBI provides a set of metrics for analyzing issue change history over time.
For this report, you might want to use the measure “Issues history” and dimension “Transition Status” to see how many issues were in each status (backlog, In Progress, etc.)at the end of each day (Import issue change history).
This is how you can build the report.
-
On columns, select measure “Issues history” to represent issue changes over time. And another calculated measure “Time within Sprint” to limit the reporting period based on the selected sprint start and end dates.
-
Set the “Sprint” dimension on report pages. In the report filter, select one sprint to run a report at a time, also while building the report.
-
Set the “Time” dimension on report rows and select the data representation level Day.
-
Click on measure “Time within Sprint” and filter rows that have a value greater than 0. This way you will limit reporting period to match the selected sprint.
When the filter is in place, you may remove the column “Time within Sprint” from the report, but the filter criteria will remain (Create reports)
-
Now you can set the “Transition Status” dimension to report rows or pages, ar you find the report easier to read.
-
If you would like to see which issues are behind each number, click on the value and chose to Drill through issues .
I do not recommend setting the “Issue” dimension on report rows as it might slow down the report significantly and such a matrix is hard to read.
-
Make sure the option “Nonempty” is disabled.
The report might look like this:
Best,
Zane / support@eazyBI.com
1 Like
Thank you very much for your answer.
@zane.baranovska
Taking advantage of the instance, I wanted to ask you another question.
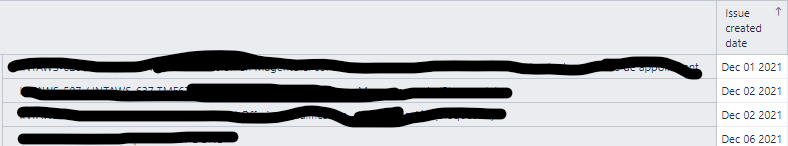
I have these 3 issues with the creation date of each one, how can I get a measure that gives me the oldest date, that is, Dec 01 2021?