Hi,
As we have built out many of our eazyBI reports, we keep coming up to with questions regarding how the time dimension works in some of our reports, mostly to do with how a number of measures are represented in the pivot table depending on the time member.
For example, if I have July selected, are the issues being pulled in based off their submission date, date started, logged work, etc. Along the same line, is there a way to specify how we want the time dimension to pull in issues - for example only pull in issues for the month of July that have time logged to them in that month OR only pull in tickets due in July.
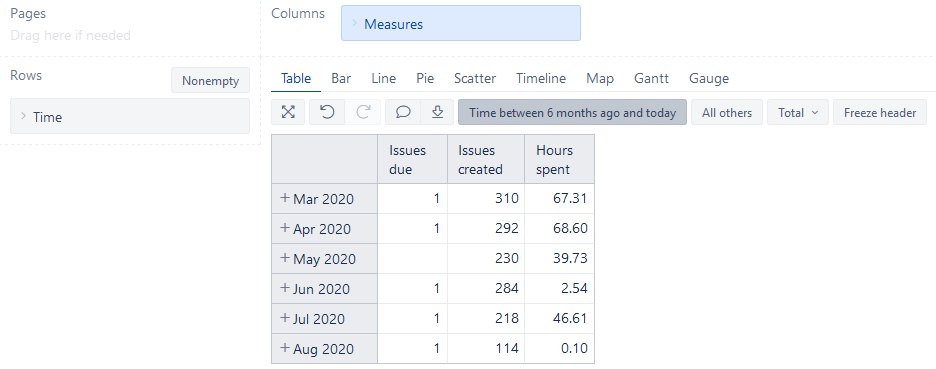
When you have the Time dimension in your rows and a measure in the column. The measure in the column will show the information specific to the measure for that month. So for example, if I have Issues created and Hours spent in my columns and in my rows I have May of 2020 through August 2020. Each row will display the issue created as well as the Hours spent in that month.
It’s not that EazyBI is “selecting issues” to show, but that it’s showing the data associated with the intersection of those points. It’s like you’re telling EazyBI to find me the data that meets at the intersection of May 2020 and Hours spent. the result is all of the hours spent in May 2020.
To get to your example -
If you put Issues Due, Issues created and Hours spent in the column and the months in the Rows; Each row would show you the data found at the intersection of those points. Month vs Issues Due, Issues created and Hours spent.
Hopefully this helps to make sense of it.
Thanks @dzygadlo for the detailed answer!
@Matthew_Feldman if you want to learn more about how Time dimension works (besides answer that @dzygadlo provided) , I suggest watching my colleagues Roberts presentation It’s About Time from eazyBI Community Days 2019 - Videos: create reports and charts
best,
Gerda // support@eazyBI.com