Hi,
I have a couple of Jira tickets assigned to a Name and a Stage by labels. Each ticket has a unique combination of Name and Stage. Both of them are extracted as customfields by JS and imported as dimension and property. Storypoints is imported as measure and porperty as well.
With the imported fields:
“Name_Val” (customfield string),
“Stage_Val” (customfield integer),
“Due date” (normal jira field),
“Story Points” (normal jira field)
I can get a table like this:
| Name | Stage | Due date | StoryPoints | Sum due |
|---|---|---|---|---|
| A | 1 | 01.01 | 20 | 20 |
| A | 1 | 01.06 | 40 | 60 |
| A | 1 | 01.09 | 40 | 100 |
| A | 2 | 01.10 | 30 | 30 |
| A | 2 | 01.12 | 70 | 100 |
| B | 1 | 01.01 | 45 | 45 |
| B | 1 | 01.07 | 55 | 100 |
The % Due ([Measure].[Sum Due]) are calculated by:
NonZero(
  Sum(
  [Issue.Epic].[Parent].GetMemberbyKey([Issue].CurrentHierarchyMember.Key),
  Sum(
    Filter(
      [Issue].[Issue].Members,
      DateCompare(
      [Issue].CurrentMember.get('Due date'),
      [Issue.Epic].[Parent].CurrentMember.Get('Due date')
      ) <= 0
      AND
      [Issue].CurrentMember.Get('Name_Val') MATCHES [Issue.Epic].[Parent].CurrentMember.Get('Name_Val')
      AND
      [Issue].CurrentMember.GetString('Stage_Val') MATCHES [Issue.Epic].[Parent].CurrentMember.GetString('Stage_Val')

        ),
      [Issue].CurrentMember.Get('Story Points (Portfolio)')
      )
    )
  )
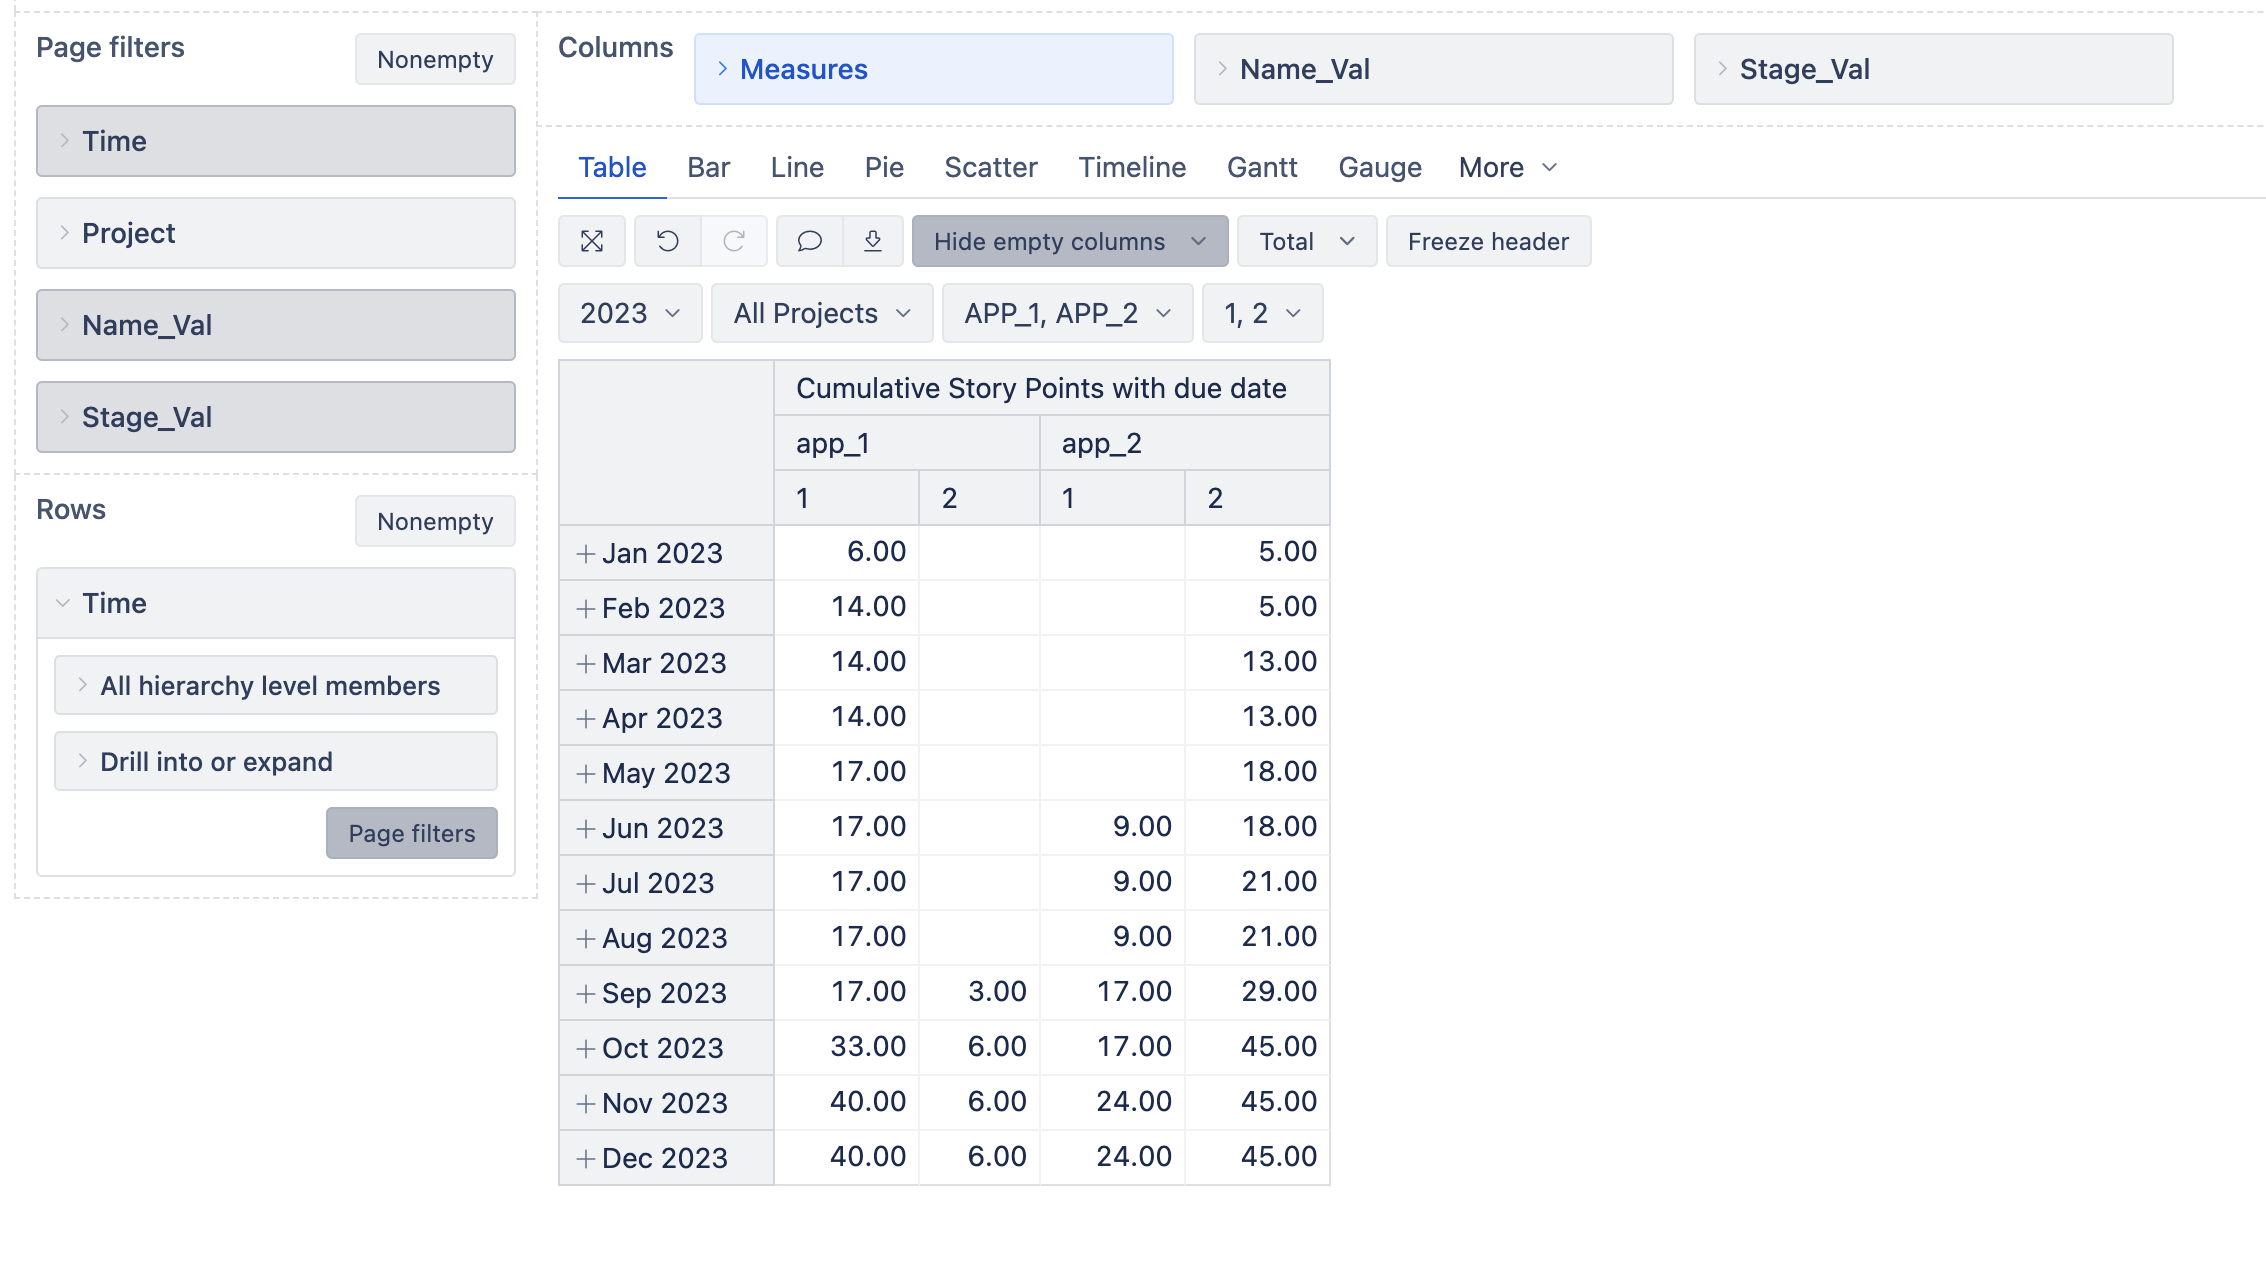
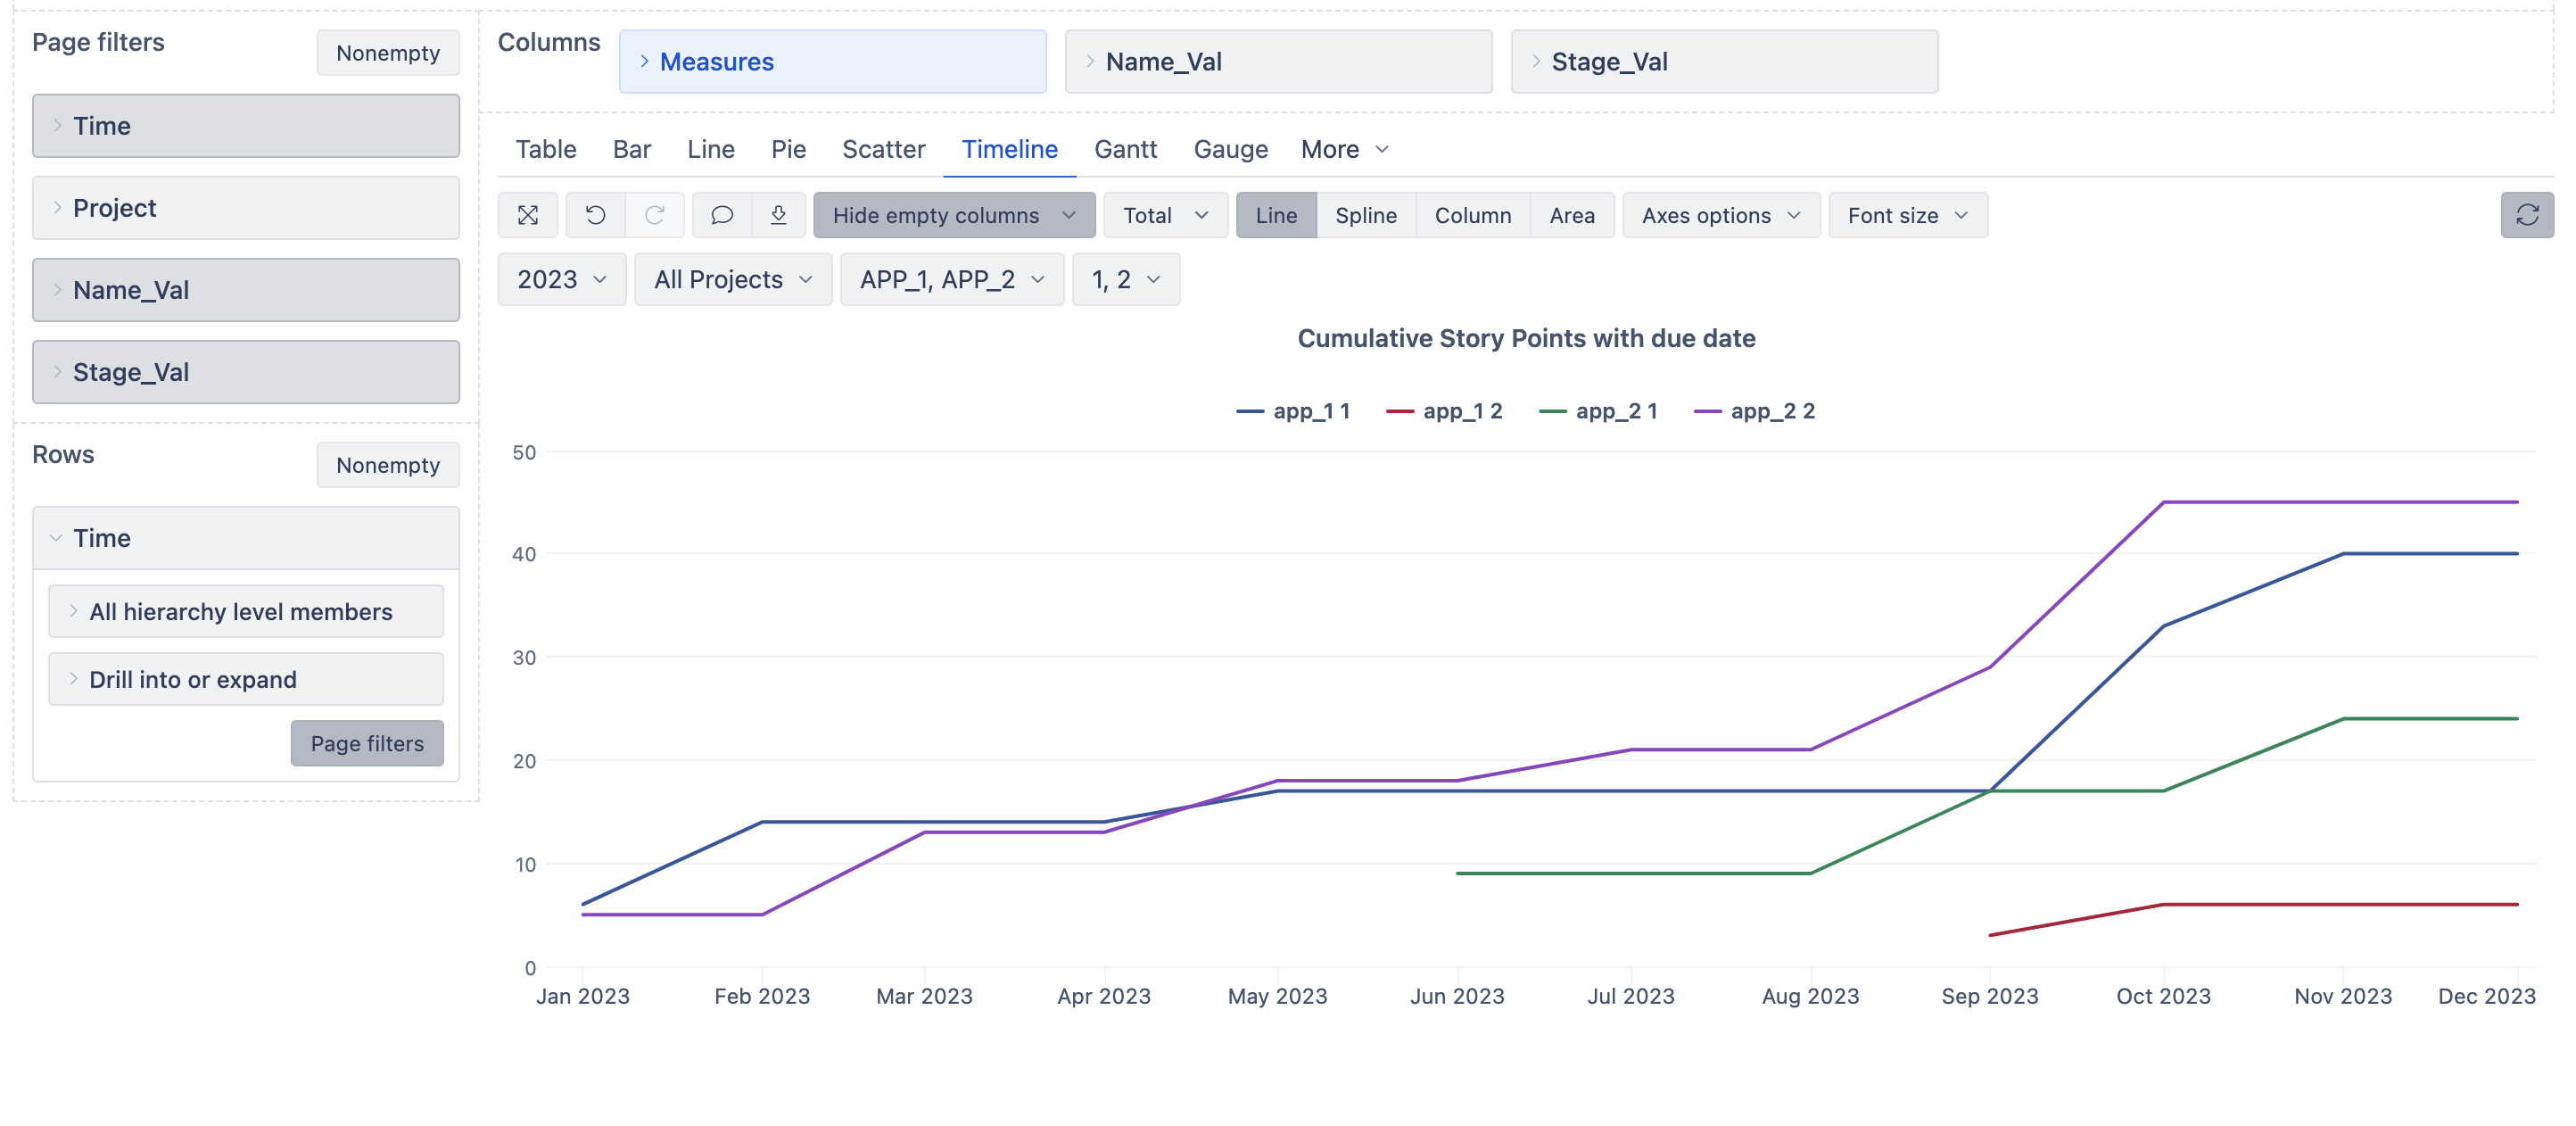
The goal is to show a line graph/timeline consisting of a series of lines depicting the Sum Due for each combination of Name and Stage over Time. In my upper exapmple it would show 3 lines A1, A2 & B1.
Unfortunately with [Measure].[Sum Due] the Time/Due date gets lost.
Next step would be to not show the Sum due but the percentage (= [Measure].[Sum Due]/[Measure].[Sum Due total])
I thought maybe I’m completely on the wrong track and have to use something I found in the templates like:
CatchException(
  CASE WHEN [Measures].[Story Points (Portfolio) with due date] = 0 THEN 0
  WHEN NOT IsEmpty([Measures].[Story Points (Portfolio) with due date])
  THEN
    [Measures].[Story Points (Portfolio) with due date] /
    ConstantColumnValue(Sum(TotalRowsSet(), [Measures].[Story Points (Portfolio) with due date]))
  END
)
But in this case I cannot filter for Name and Stage combinations. I saw some answers proposing to create a JS to assign a combination A1 etc with Import already but the number of combinations is just to big and therefore needs to be dynamic.
Any help is highly appreciated!