Is it possible to create a timeseries chart with a custom date field? I have the field (called implementation date) imported as a Measure, but I don’t see anyway to get this moved to Columns in place of Time.
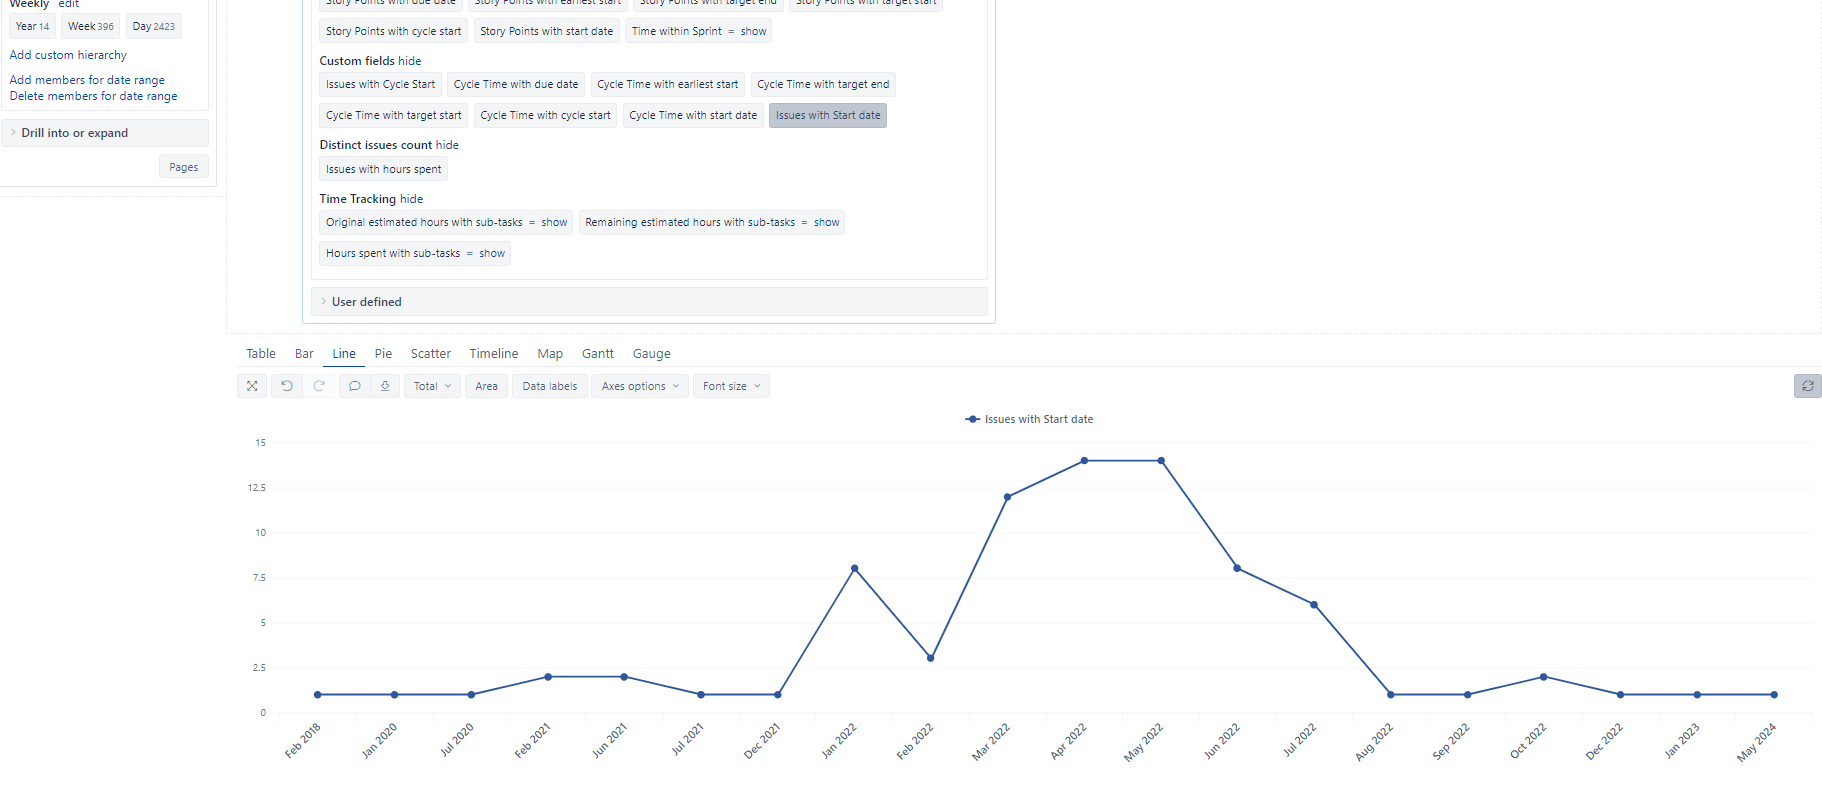
All I’d like to do is re-create this chart: