I am creating a dashboard which is going to house ~6 reports that were generated at different time intervals. I would like to show the timestamp for each of the report. How to do this?
I tried to add the description text box … but, it seems there is no possibility to show the timestamp in markdown format … any help would be appreciated.
Hi @Srinivasan.Sairam,
When you run a report, for example, open a report or a dashboard where a report is published, the report is refreshed with the latest imported data. If all six reports are published on the same dashboard, all reports are updated at the same time.
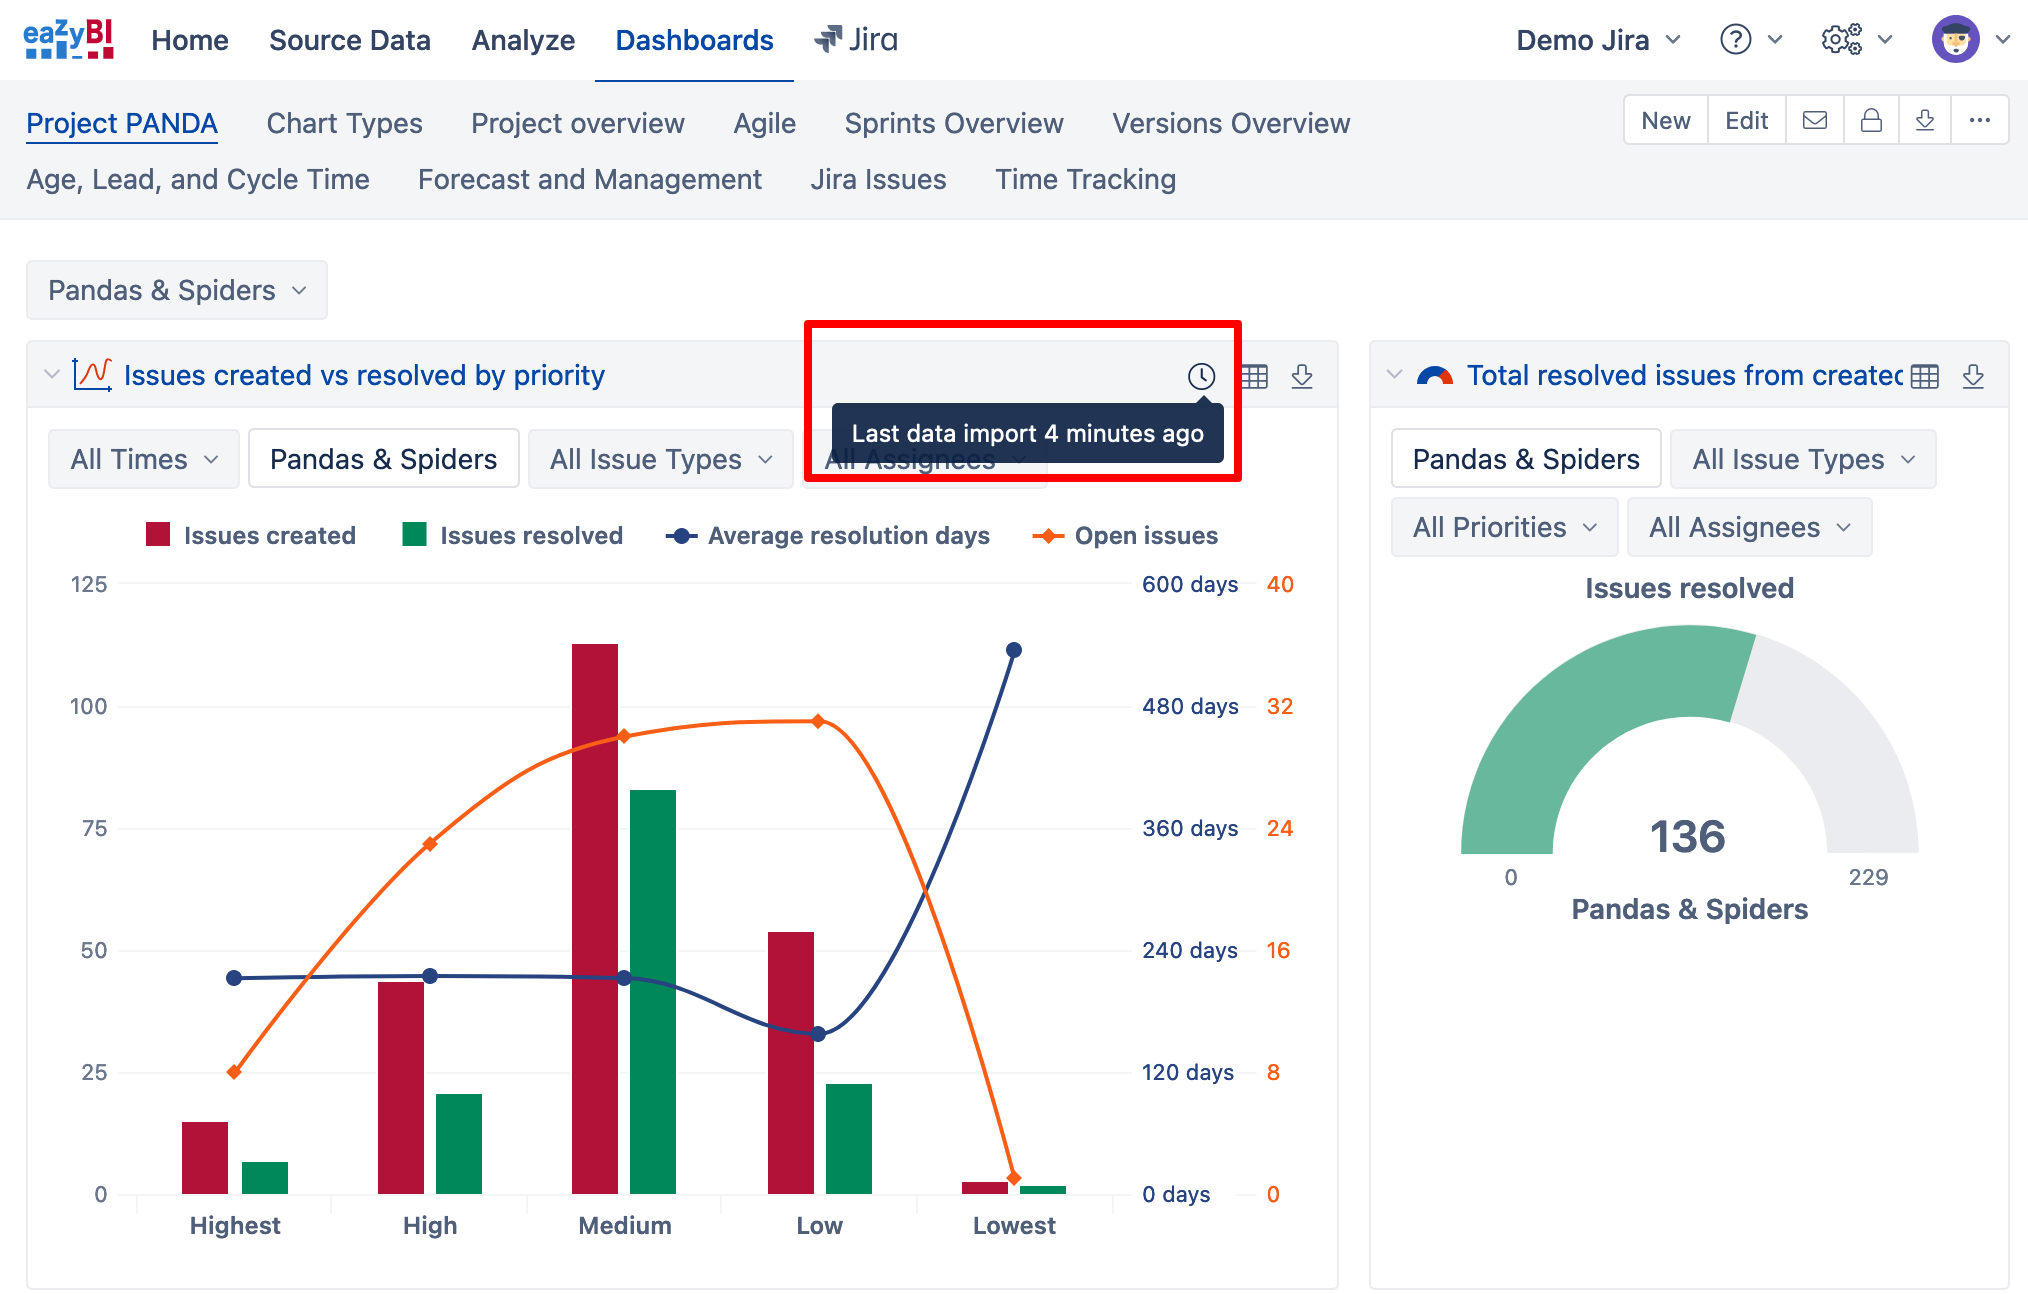
On the dashboard, you can also see the last time when the data were imported from Jira in eazyBI. When you move a cursor on any report heading, the clock icon appears and shows the last data import time (see documentation how to Interact with dashboard).
Best,
Zane / support@eazyBI.com
But, it does not say when (actual date / time) the report was generated (or data was refreshed). In the above example, it says " 4 minutes ago" … but, “4 minutes ago” since when?
The use case here is … that the report will be exported (as pdf) and will be shared to senior management (MD, VP, SVP,…) and needs a report generation date and time.
@Srinivasan.Sairam in this case, yuo can creatre a simple report that would shoe the timestamp when it is opened (refreshed) and this report to all dashboards where you would like to show this date and time.
-
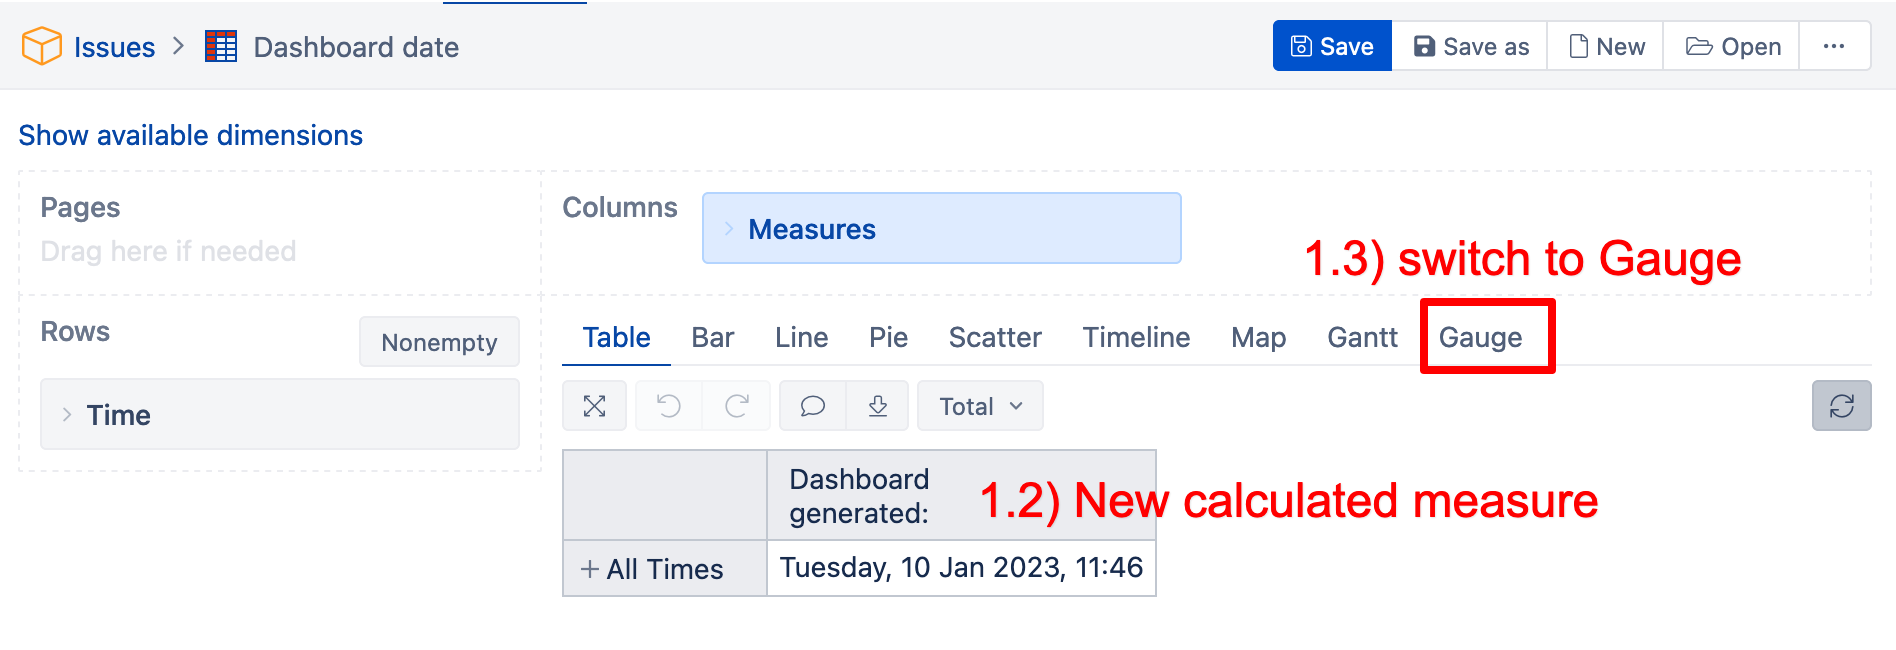
Creat new report.
1.1) On report rows, set dimension “Time”, and leave All Times as only member.
1.2) Create a new calculated measure in Measures to show the current date and time and select only this measure for the report (Calculated measures and members)
Expression to get current date and time might look like this:
Format(Now(),"dddd, dd mmm yyyy, hh:mm")
The report layout should look like in the picture below.
1.3) Switch to the Gauge chart type and select option Only values.
1.4) Save the report as “Dashboard date” or “Report date”, or similar name.
-
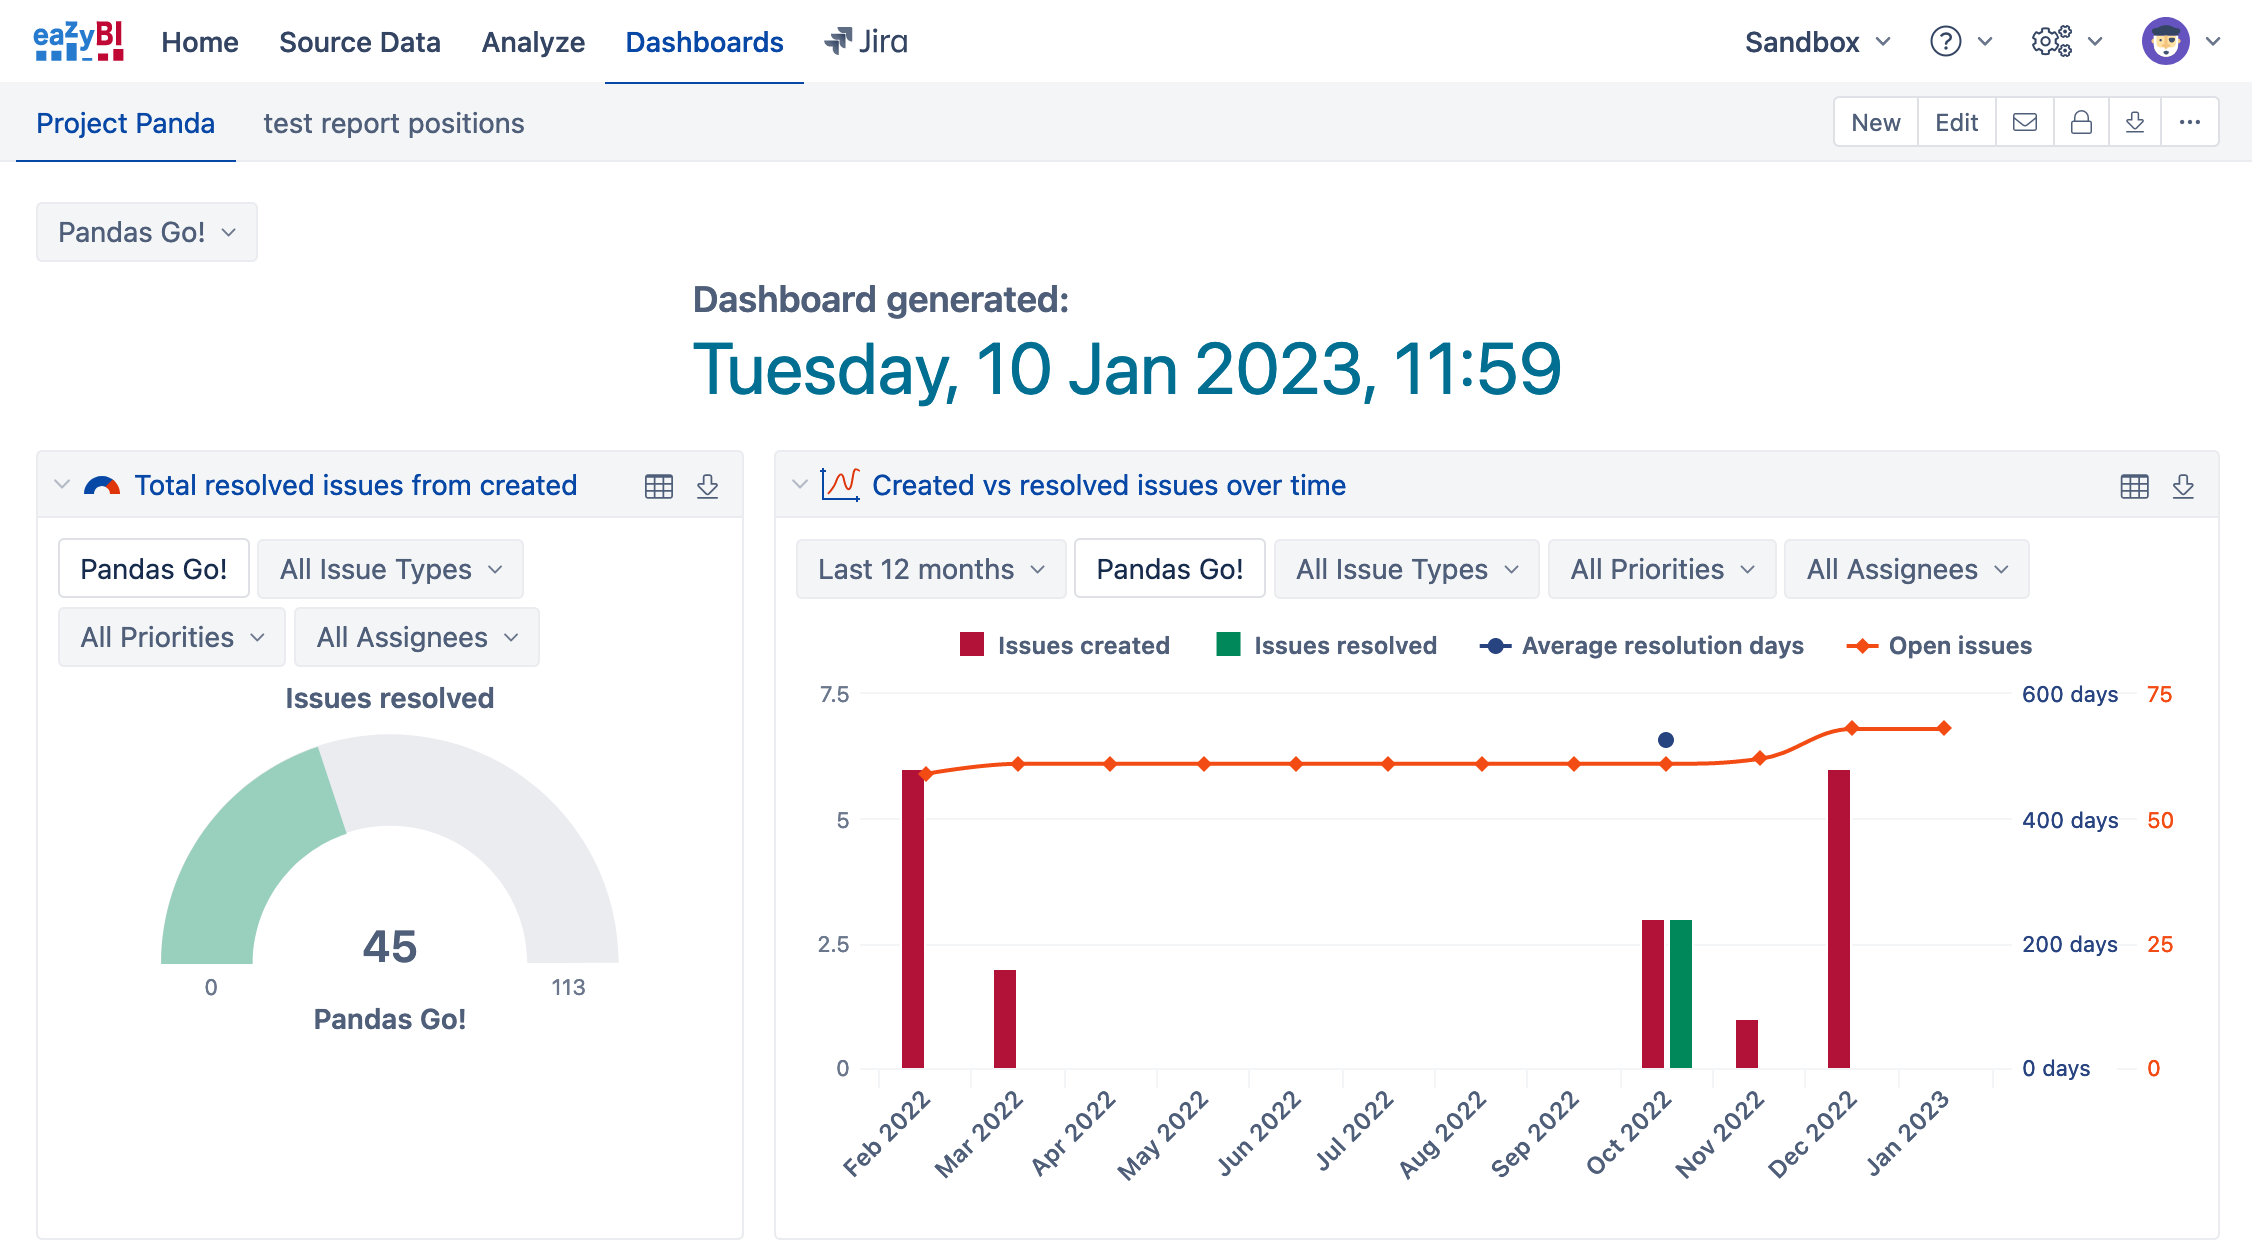
Add the newly created report to the dashboard. if you would like a more neet look, disable Frame for the report (Create dashboards).
However, this date and time are when the dashboard is generated but won’t include information on when the data are imported in eazyBI. If you are planning on generating dashboards as PDF, consider scheduling/subscribing to them in the email at a specific time that would be right after data import: Email subscription
Best,
Zane / support@eazyBI.com
Thanks … this works and this is what I was looking for
1 Like