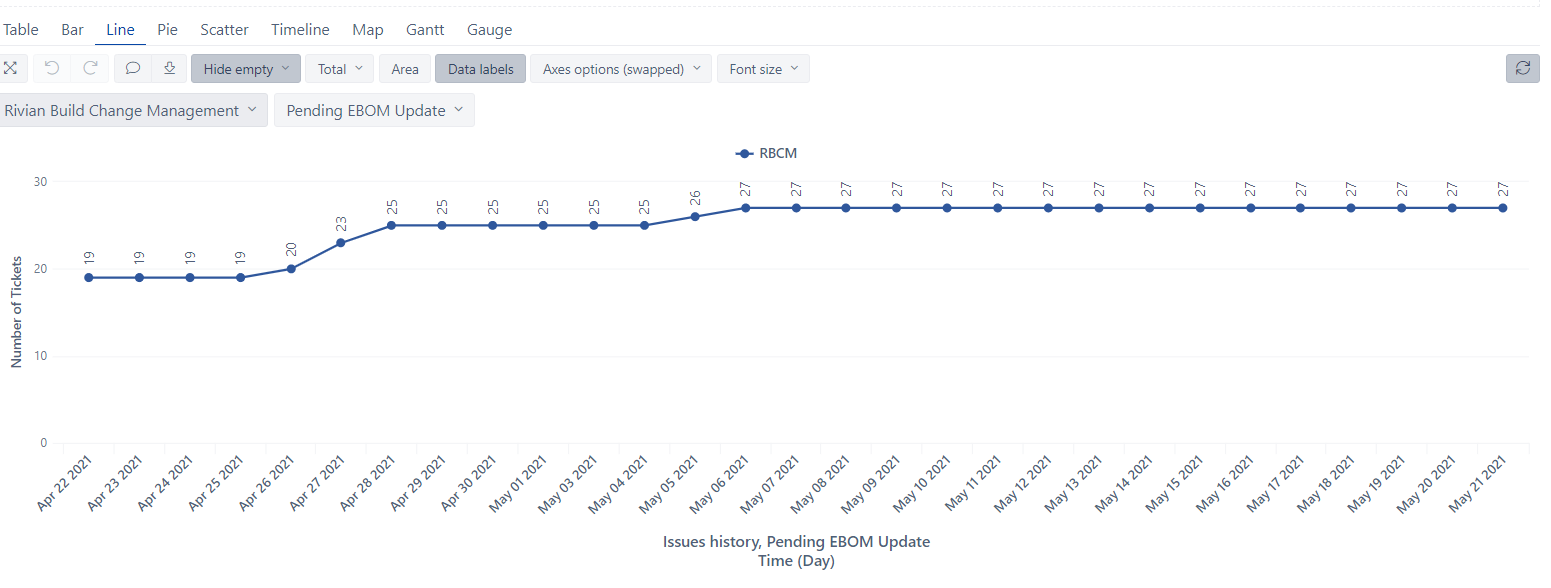
Hi, I have created a line graph that supposes to show the number of tickets in the specific status (“Pending EBoM Update” ) every day. I currently using the “issue history” code for measurement but for some reason, the number get averaged out for 7-10 days as we close or add more tickets in the status.
How can measure the number of tickets for each day at a specific time?
You might want to use [Measure].[Transition to Status] and the [Transition Status].[Pending EBom Update] dimension/member in columns.
This will give you all issues that have been moved to status “Pending EBom Update” in a day, even if they are no longer in this status at the end of the day.
The Transition to Status measure, similarly to Issue History, will ensure that you are looking at historical data, but if it’s coupled with Status, instead of Transition Status, it will still count the transition only if the status is still “Pending EBom Update”.
Measure “Issues history” shows the total number of issues in the given status at the end of the selected time period. To get this number correct, use it with “Transition status” dimension.
Measure “Transitions to status” shows the total number of transitions to the given status within the selected time period.
Measure “Transitions to status count” shows the total number of issues transited to the given status within the selected time period.
Both of them also must be used with the Transition status (or Transition) dimension.
And @Marilou is right, additionally used with Status dimension in pages, those historical measures would be calculated only based on issues that currently are in the status selected there.
@ilze.leite Measure “Transitions to status count” shows the total number of issues transited to the given status within the selected time period.–> How to specify the “to status” name here