HI.
I want plot linear line graph between empty data.
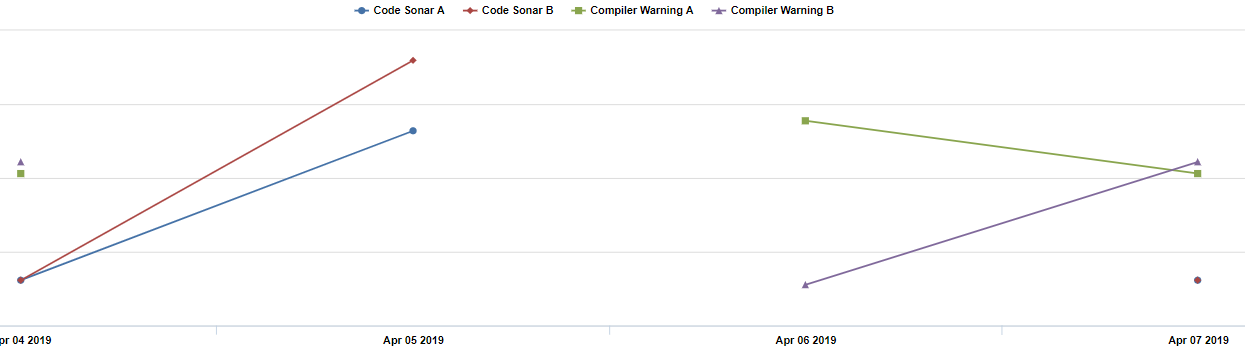
Look at Line Graph… The graph is cut off.
How can I make Linear Graph?
Help me…
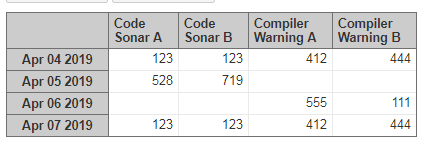
DATA Table
HI.
I want plot linear line graph between empty data.
Look at Line Graph… The graph is cut off.
How can I make Linear Graph?
Help me…
Hi bbyoo,
You can resolve this problem by replacing 0 for empty cells, below are the steps,
add case statement in your measures,
example :
Case
When
isempty([Measures].[Code Sonar A])
then
0
else
[Measures].[Code Sonar A]
End
Now, your empty cells will be replace with 0’s.
Apply the code for different measures . hope it helps:)
Hi. Ganesh!
Thank you for your reply.
But if empty cell --> 0,
the data doesn’t right.
The meaning of a empty cell is that it is not tested.
But Putting ‘0’ means test results is Zero.
That means two things have different meanings.
Do you know anything else?
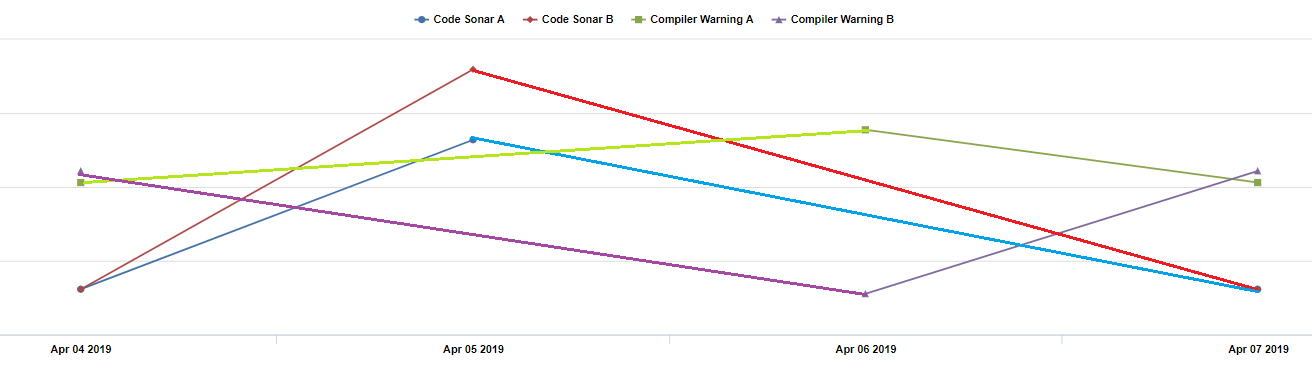
Line chart connects dots only if there are any values for any data point. For this chart I would suggest using Timeline chart. Timeline chart works with time dimension on Rows only as it is in your case.
Timeline chart line type will connect any dots, ignoring missing values for any period in between.
Daina / support@eazybi.com
Thanks daina