Each Test Cycle in Zephyr has the following field: “Total Execution Time”, with the help of EazyBi I would like to create a graph which will show a “Total Execution Time” for different test cycles. In Jira it can be done using this gadget: “Test Execution Time Tracking”, but there is a limitation: there is no option to select multiple testing cycles/folders at the same time. Therefore I am trying to figure out how it can be done via EazyBI. Could you please help?
In eazyBI integration with Zephyr there isn’t a default possibility to see the Total Execution Time, but it is possible to create a calculated measure in Measure dimension that will return information about Original estimate time for Test Cycles.
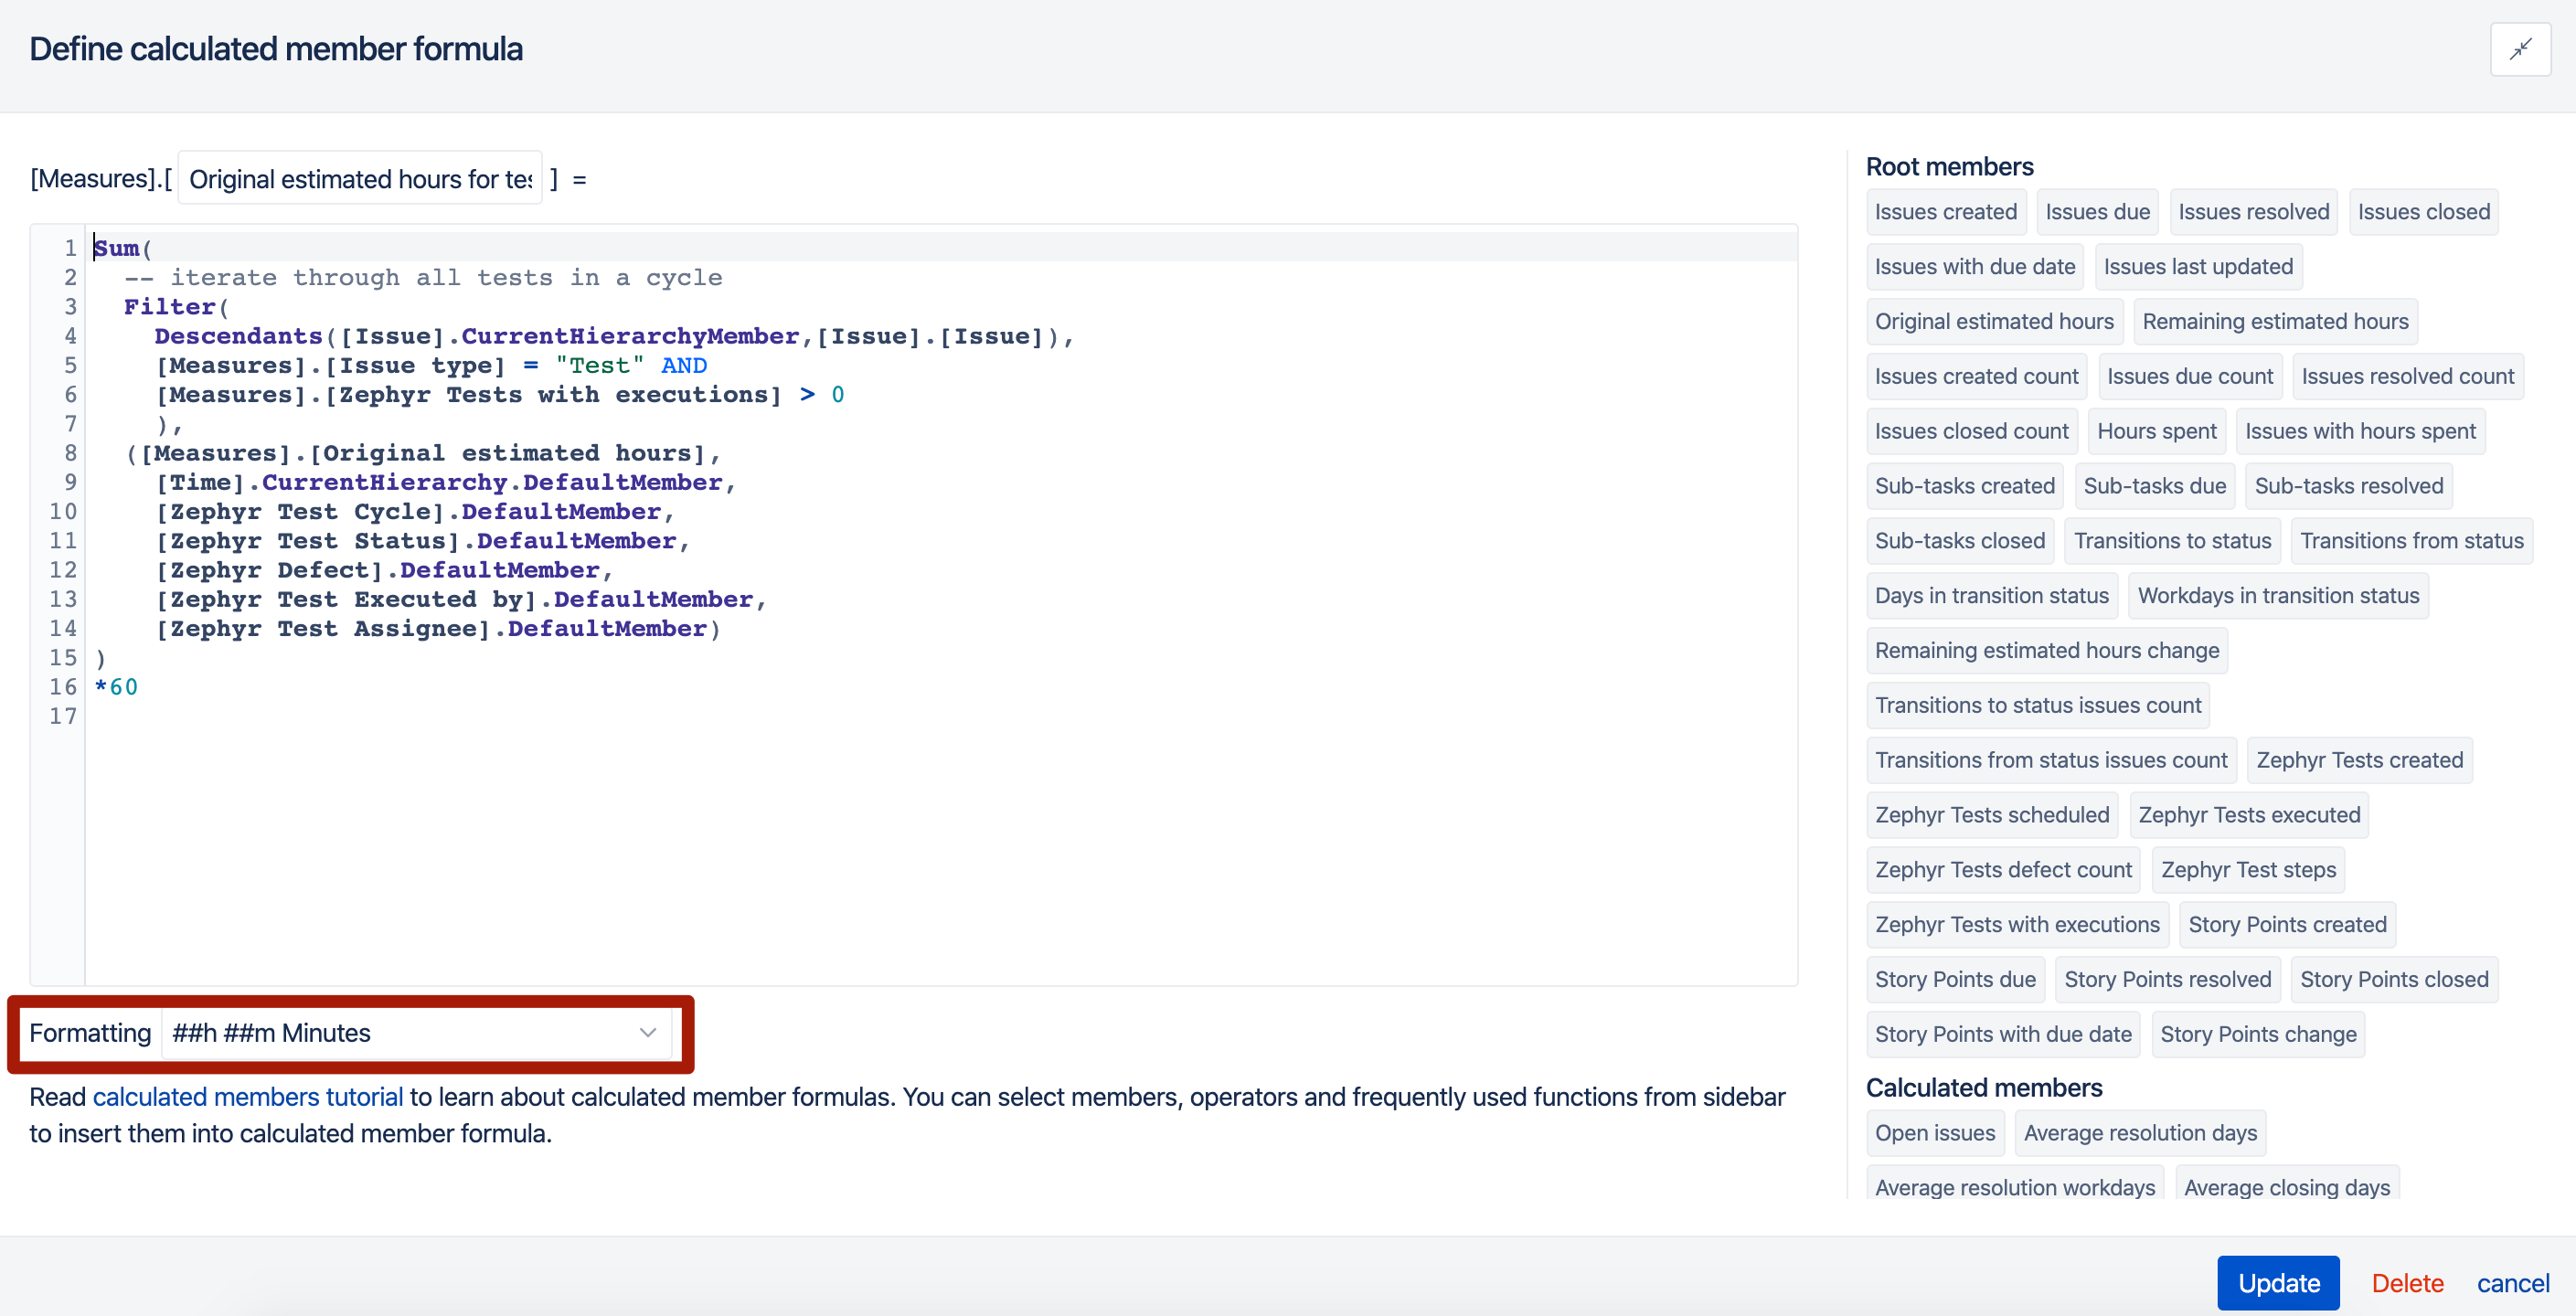
The formula is this:
Sum(
  -- iterate through all tests in a cycle
  Filter(
    Descendants([Issue].CurrentHierarchyMember,[Issue].[Issue]),
    [Measures].[Issue type] = "Test" AND
    [Measures].[Zephyr Tests with executions] > 0
    ),
  ([Measures].[Original estimated hours],
    [Time].CurrentHierarchy.DefaultMember,
    [Zephyr Test Cycle].DefaultMember,
    [Zephyr Test Status].DefaultMember,
    [Zephyr Defect].DefaultMember,
    [Zephyr Test Executed by].DefaultMember,
    [Zephyr Test Assignee].DefaultMember)
)
*60
Don’t forget to change the formatting to ## hours, ## minutes