Hi team,
This is a 2 part question:
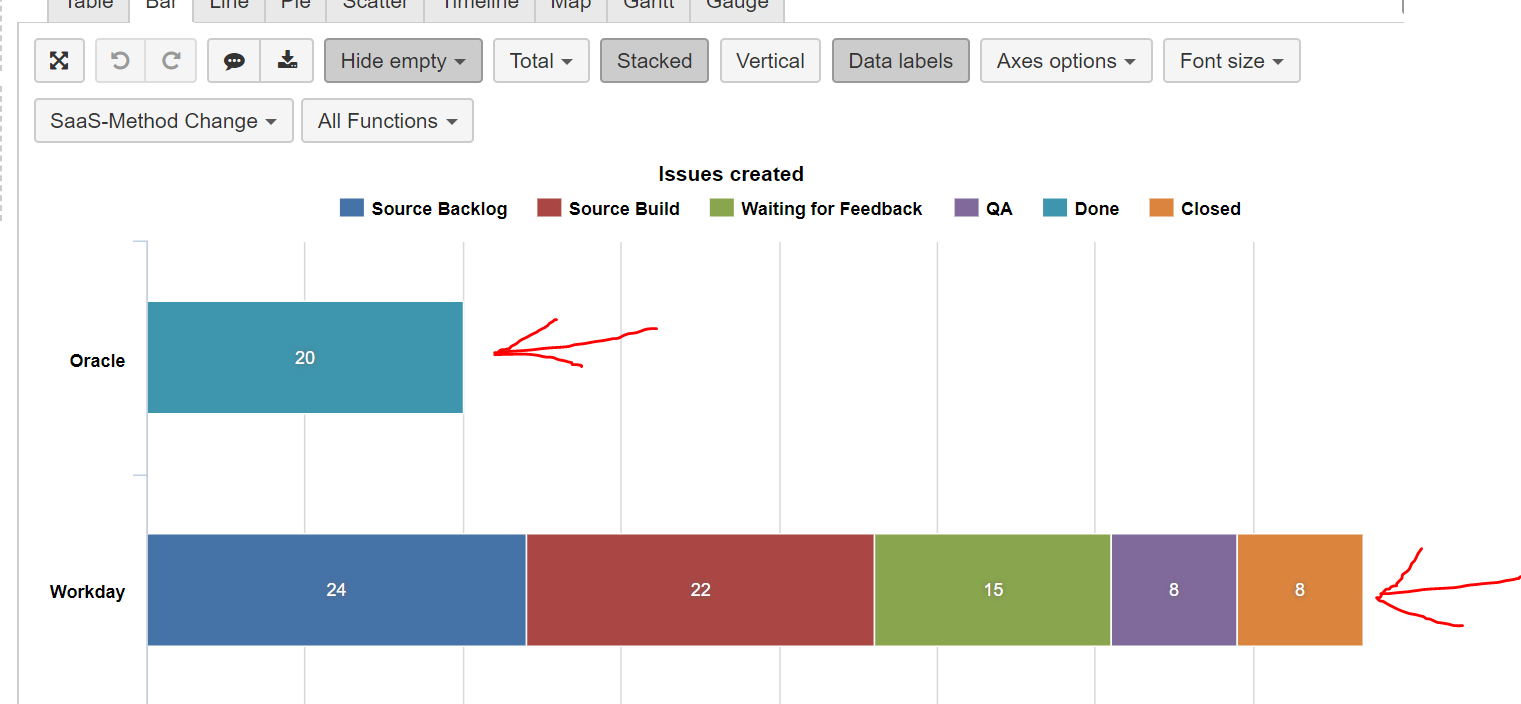
I have a report in which I’m stacking multiple columns into one with their individual values being shown through data labels.
I want the sum/total of all these values on the top of stack. When I use ‘Total’ tab, it creates a new bar which I don’t want. I want the data to be shown on the same bar stacked with multiple columns.
Please find attached screenshot.
Secondly, how can I show the value as well percentage both in same bar. For eg, For Workday… it should display [ 24 31.16%] [22 …%] …
Many thanks in advance 
Hi @simarpreet_singh
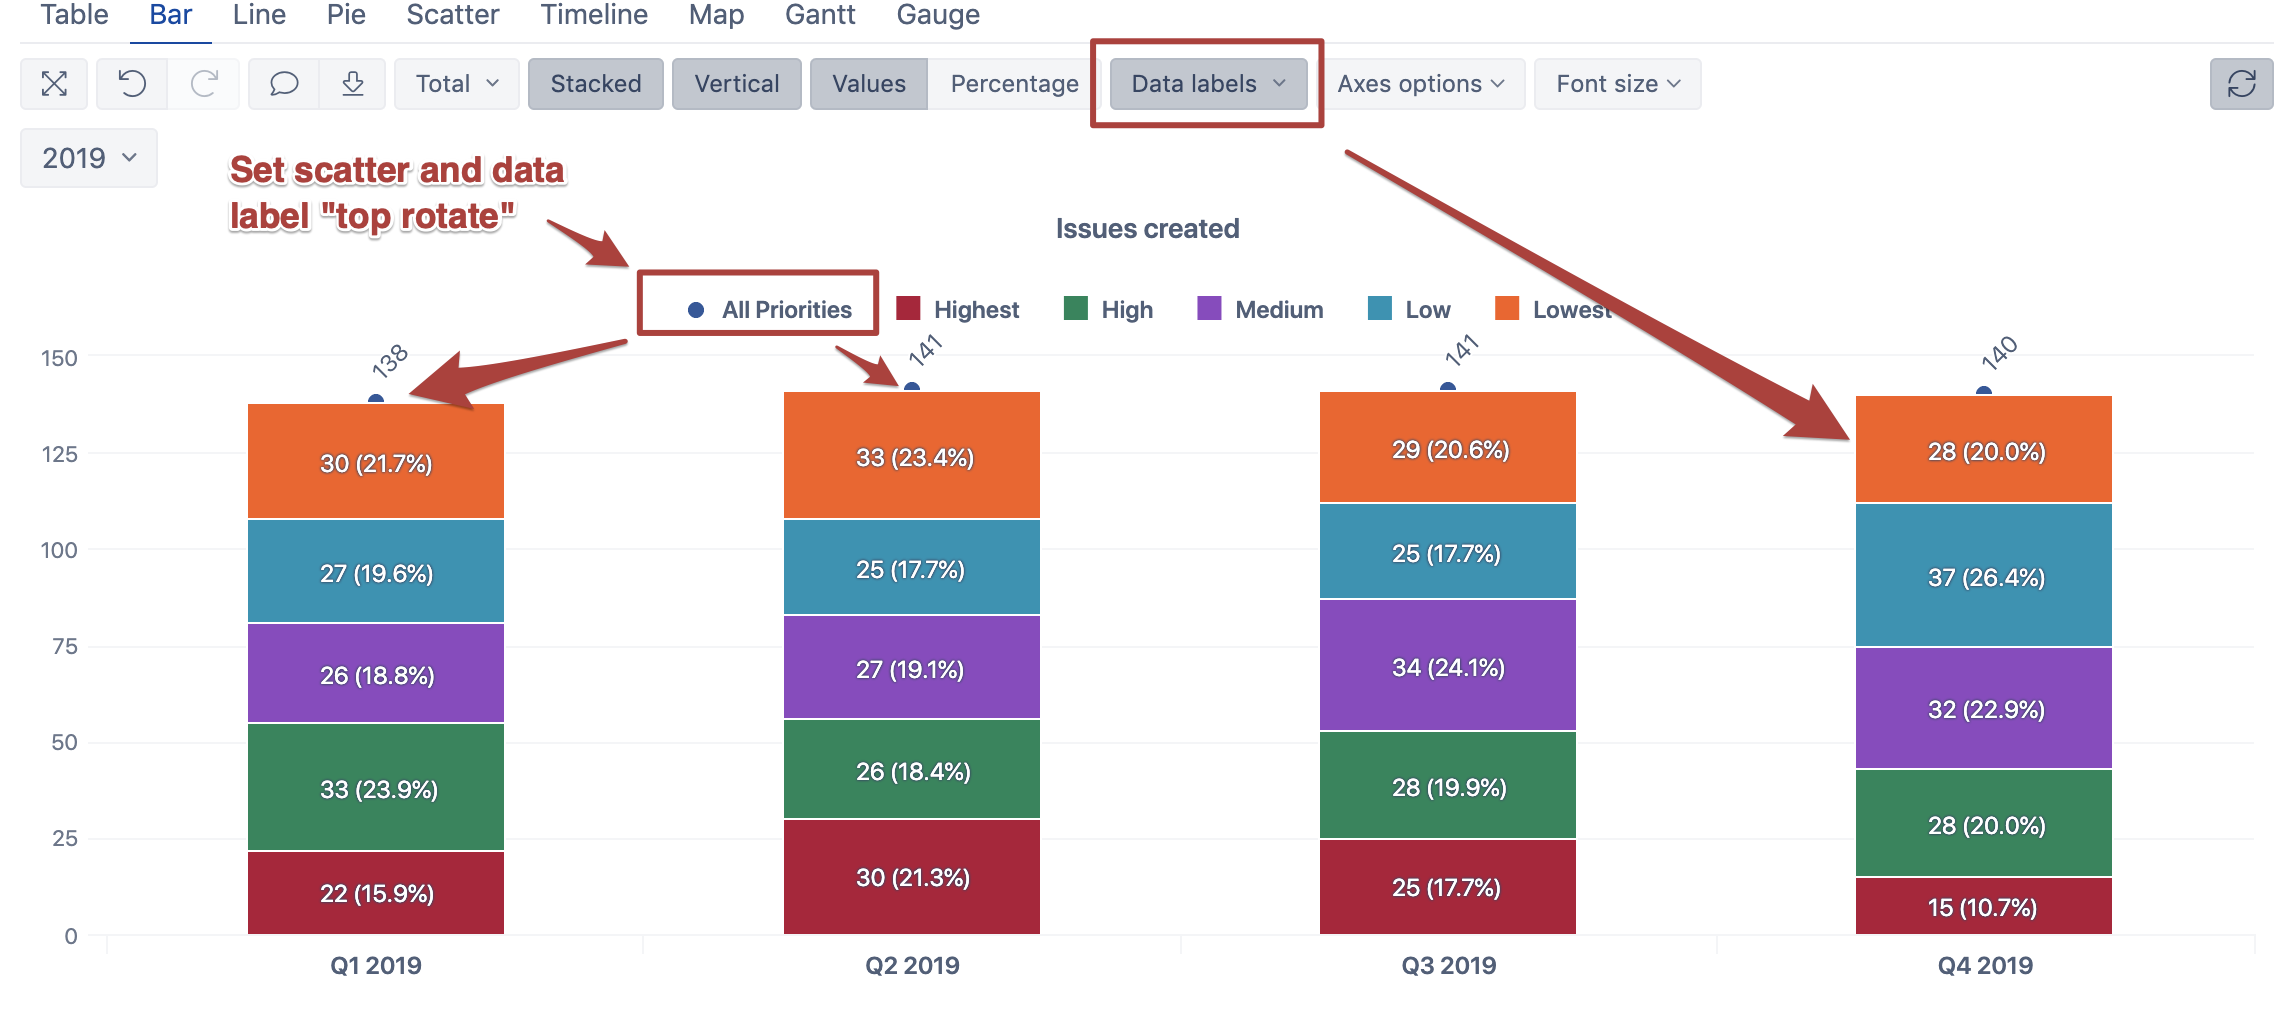
You may want to do the following trick: in the report, add also All level member for the status (if you do not use all statuses in the report, create a calculated member where those needed statuses are aggregated and add the calculated member and expand it). Then, for the All level member (or the top member of the calculated member) change the Type from bar to scatterand set Data label “Top rotated” for this member.
For the rest of the chart, use option Data labels = “Values and percentage” (available in latest eazyBI versions).
See screenshot below:
You may check out my eazyBI Community Day presentation “How to create smart reports without MDX” where I demonstrated how to use scatter chart for showing total values in a bar chart: https://eazybi.wistia.com/medias/d40b5to6v6 (around 14:40)
Best,
Ilze / support@eazybi.com