I have 4 issue statuses that I need to display on a bar graph by month. So when looking by month it would give a count of how many issues in each status for that given month. I’m new to eazybi and have tried deconstructing some of the example reports with little success. This seems like it should be an easy report to build, but I’m missing something. I did some searching, but must have overlooked some obvious examples.
I believe that with several Tuples you can build the measurements you need.
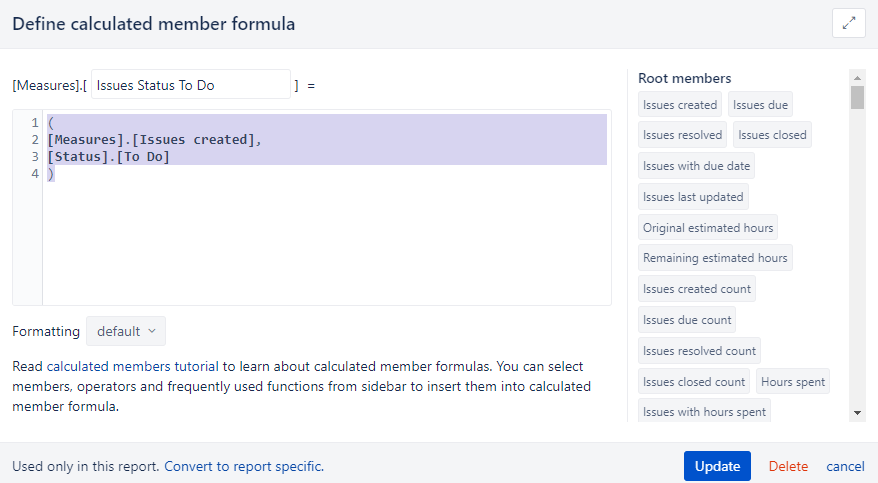
This is an example for issues created with To Do status
(
[Measures].[Issues created],
[Status].[To Do]
)
For more and better information: Calculated measures
Hi @calkno ,
It is great to hear that you started with the sample reports and tried to adapt one to your needs.
The report you were probably looking for might be this one - Unresolved issues by statuses over time.
Louis led you in the right direction, but there is a slight difference between the issue Status and Transition status.
The Status dimension holds the current status for the issues - it works best with the measures as ‘Issues created’, ‘Issues resolved’, etc.
The Transition status dimension holds transition statuses - the status of an issue at a particular moment. This dimension works best with a measure ‘Issues history’. The Transition status becomes available once you have e selected to import Issues history into the eazyBI data cube - Import issue change history.
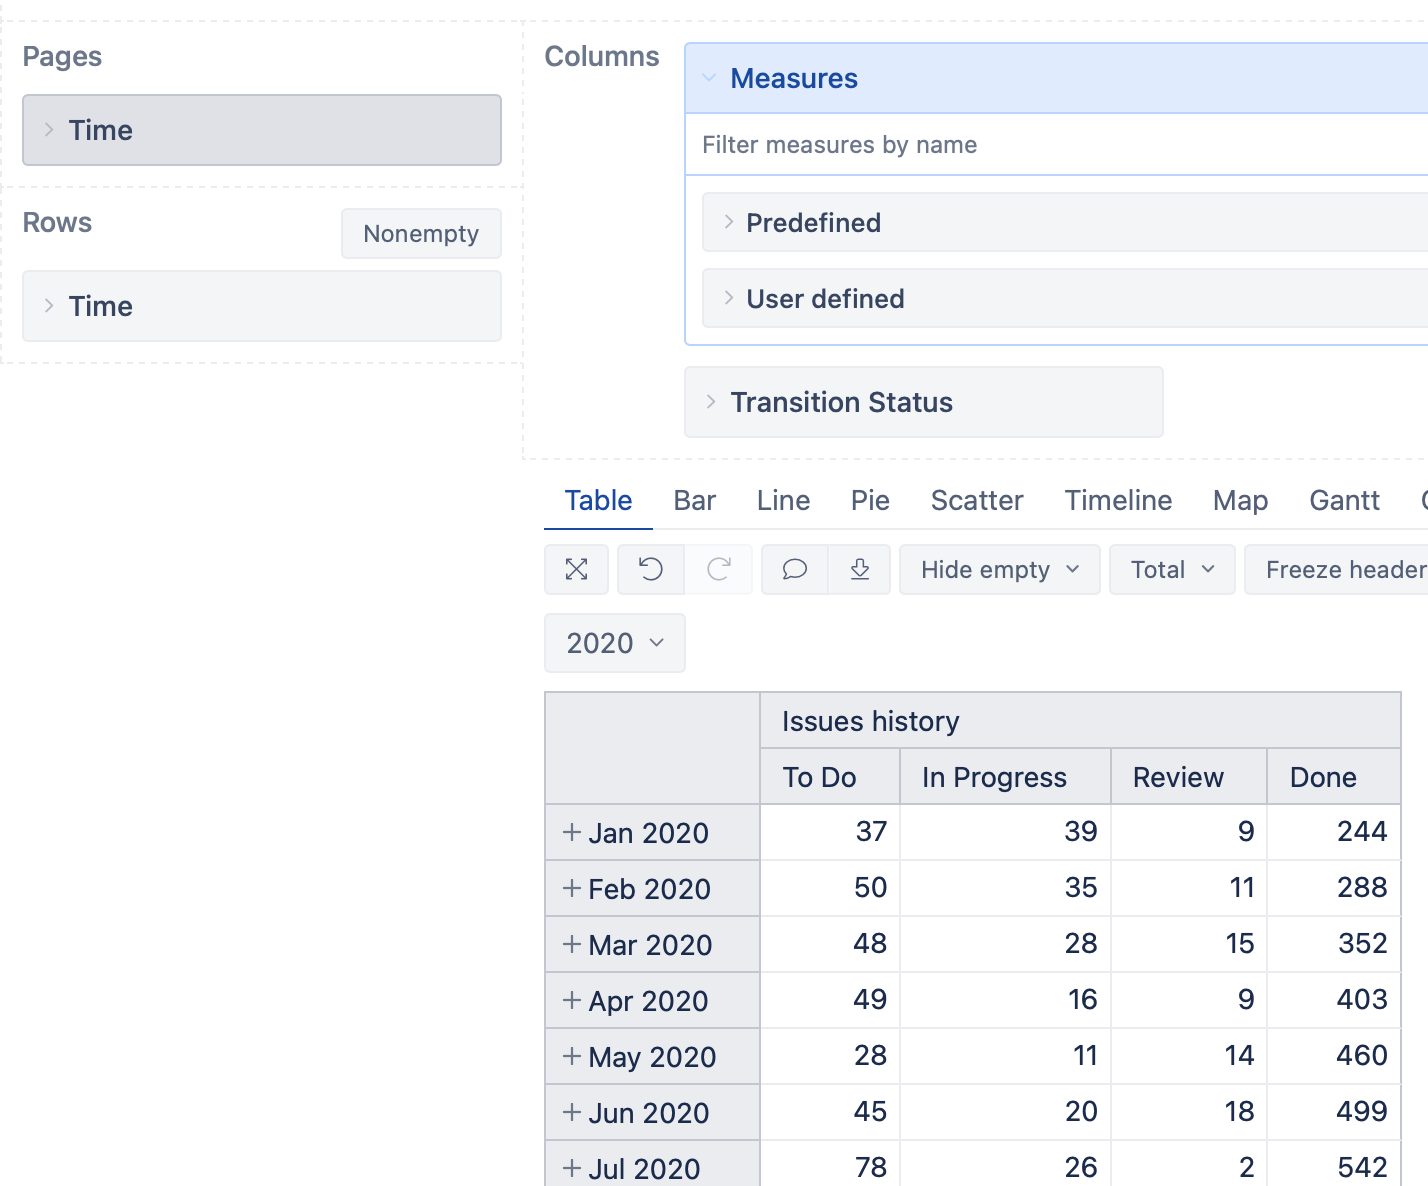
Suppose you would like to start from scratch and build a report showing the number of issues within a certain status at the end of each time interval (day, week/month, year).
In this case, you might put the Time dimension to the report rows, choose the Measure ‘Issues history’ and add the Transition status dimension to the columns.
Oskars / support@eazyBI.com
How could I make the “Done” column NOT cumulative over the entire year, but a representation of items moved to “Done” for that specific month?
The measure ‘Issues history’ allows seeing issues that were in a specific status at the end of the selected period.
Another measure - ‘Transitions to status issues count’ - would display issues transitioned into specific status within the selected period.
Creating a calculated measure that counts the issues transitioned to a particular status and remaining there at the end of the selected period is also possible. That might work fine for the ‘Done’. However, that measure would lose the issues remaining in a certain status over several periods.
Oskars/ support@eazyBI.com
“Creating a calculated measure that counts the issues transitioned to a particular status and remaining there at the end of the selected period is also possible” - can you please help, how is it possible?
I’m trying to calculate number of issues that was transitioned to a specific status during a time period (quartals), but can’t get the right formula.
You might reach the number of issues transitioned to specific status via the distinct count measure “Transitions to status issues count”.
However, if you need to find the issues that transitioned to status and remained there at the end of the period - you need to iterate through the issues set, as these are two separate conditions for the same dimension (Time).
The expression might be as follows.
Sum(
  Filter(
    DescendantsSet(
      [Issue].CurrentHierarchyMember,
      [Issue].[Issue]),
    [Measures].[Transitions to status]>0
    AND
    [Measures].[Issues history]>0),
--numerical value for sum
--checking relevance to the report context
  ([Measures].[Issues created],
--created anytime
   [Time].CurrentHierarchy.DefaultMember,
--resetting transition status as that is already filtered
   [Transition Status].DefaultMember)
)
Regards,
Oskars / support@eazyBI.com
1 Like