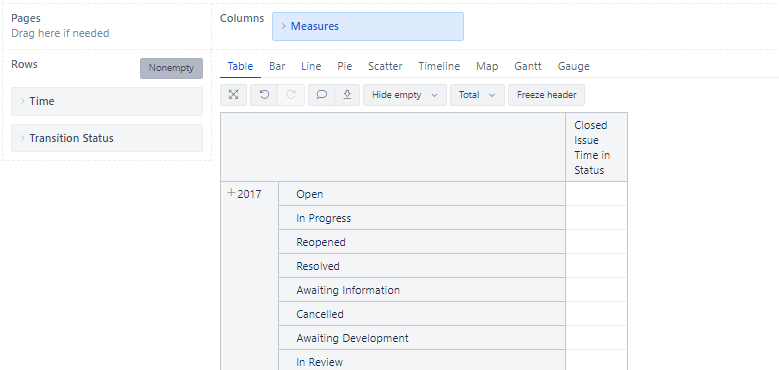
I am looking to determine if we are efficiently working issues. What I would like to see is over time, how much time do issues spend “In Progress Statuses”
Defined as:
Aggregate({
[Transition Status].[In Progress],
[Transition Status].[Resolved],
[Transition Status].[In Review],
[Transition Status].[Reopened]
})
For issues closed in each month/sprint/whatever how much duration a closed issue spent being worked. I am trying to determine if new processes are slowing the progression of issues.
I tried:
Avg(
Filter(
DescendantsSet([Issue].CurrentHierarchyMember,[Issue].[Issue]),
DateInPeriod(
[Measures].[Issue closed date],
[Time].CurrenthierarchyMember
)
),
CASE WHEN
[Measures].[Issues closed]>0
THEN
(
[Measures].[Days in transition status],
[Time].Currenthierarchy.Defaultmember
)
END
)
This was copied from anther thread here. When using this, I am not getting ant data back. I would also like to be able to see this for individual issues so we can retrospective, but I can always drill through if I need to.
