Hi, I am trying to show the percentage of projects that have hit the resolution date on time (red vs green). I’m not sure how to go about this - For example, this should show total of In time, or not delivered in time
Hi @Nrow,
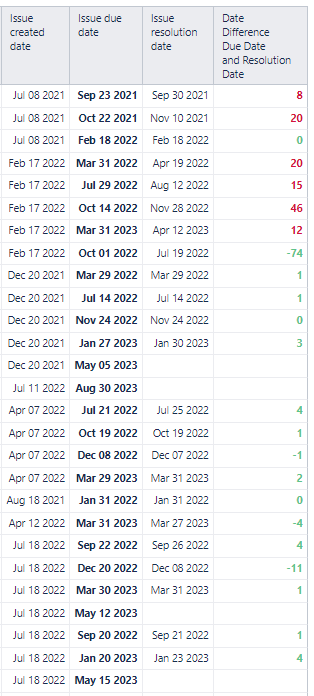
The displayed report seems to have individual issues on report rows.
If you are looking for the percentage of projects or issues that have met the due date, you might step up to a higher hierarchy level within the dimension to cover the relevant issues.
You might then perform the iteration through the underlying issues and find the number of compliant and non-compliant issues.
The proper expression depends on your definition of green and red. However, the expression for the number of green might look similar to the following.
Sum(
  Filter(
--generate set of issues within the hierarchy
    DescendantsSet(
      [Issue].CurrentHierarchyMember,
      [Issue].[Issue]),
--filter conditions
--issue has due date within current Time member
   [Measures].[Issues with due date]>0
   AND
--issue resolved within current time member
   [Measures].[Issues resolved]>0
   AND
--resolved ontime
   DateDiffDays(
     [Issue].CurrentHierarchyMember.Get('Due date'),
     DateWithoutTime(
      [Issue].CurrentHierarchyMember.Get('Resolved at')))
    <=0
   ),
--numeric value for sum
 [Measures].[Issues with due date])
You might divide this by the measure “Issues with due date” or another measure defining the total issues in scope.
Additional details about your definition of issues in scope, green, and red categories would help create the right expression for your setup.
Regards,
Oskars / support@eazyBI.com