Hi,
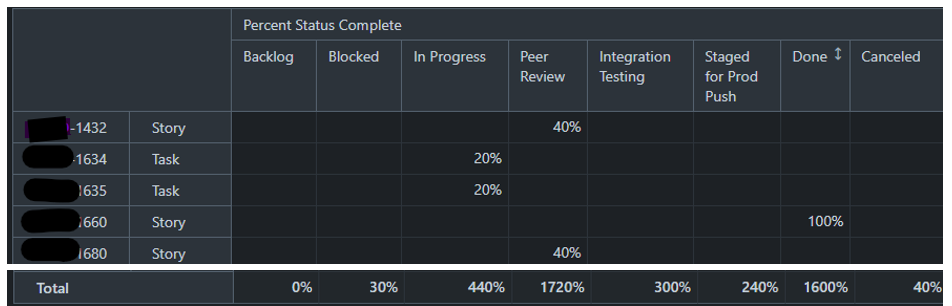
I am trying to get the total row to be a count of non empty column for each row. But I am only getting the totals to be a sum of percentages. How can I get the total row to add up the non empty columns per row?
I am expecting the total row to be: 0, 0, 2, 2, 0, 0 1, 0 in the reduced screen shots and my mdx formula.
--annotations.total=sum
Sum(
Filter(
DescendantsSet([Status].CurrentMember,[Status].[Status]),
[Measures].[Issues created] > 0
),
CASE [Status].CurrentMember.Name
WHEN "Blocked" THEN 0.1
WHEN "In Progress" THEN 0.2
WHEN "Done" THEN 1
ELSE
Count(
VisibleRowsSet()
)
END
)
Hi @swoodward ,
Formatting for the calculated measure is set for both the results in cells and the total. To separate them, I recommend setting the formatting to integer and returning the percentage for individual cells with the help of the Format() function. See the suggested formula below:
CASE WHEN [Issue].CurrentMember.Level.Name = "Issue"
THEN
  CASE WHEN
    [Measures].[Issues created] > 0
  THEN
    Format(
      CASE [Status].CurrentHierarchyMember.Name
      WHEN "Blocked" THEN 0.1
      WHEN "In Progress" THEN 0.2
      WHEN "Done" THEN 1
      END,
      "## %"
    )
  END
ELSE
  Filter(
    VisibleRowsSet(),
    [Measures].[Issues created] > 0
  ).Count
END
See more details on measure formatting here - Calculated measures , and on the Format()function here - Format.
Best,
Roberts // support@eazybi.com
Hi Roberts,
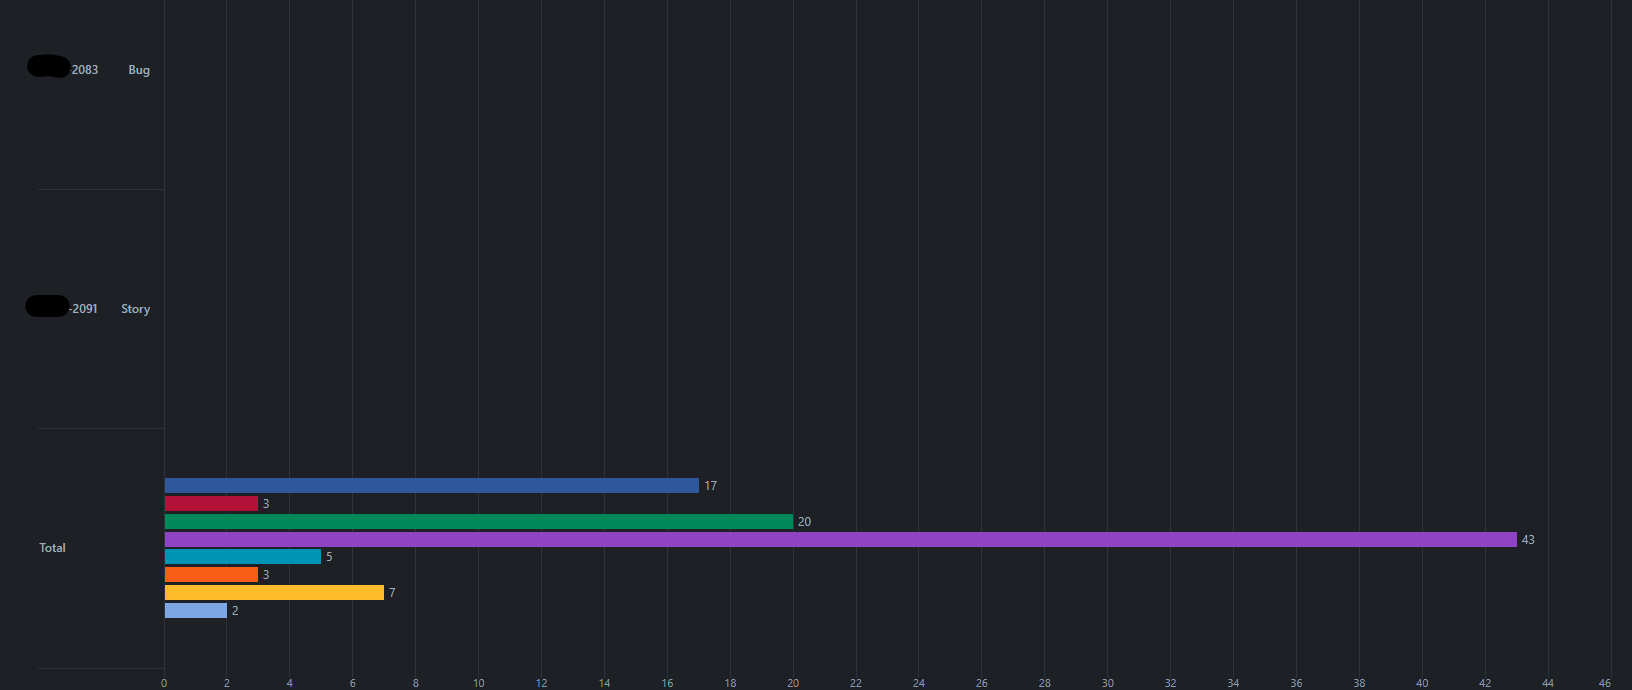
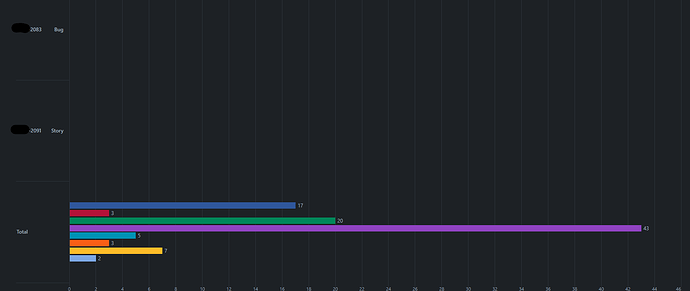
This works thank you! However, and I should have this in my original question, the individual rows are not display any percent in a bar graph view. I would like to see each issue show the percent value that is being calculated. Is that possible?
Hi Roberts do I need to open a new question? Not sure how to handle follow up quesitons.
Hi Roberts,
This works thank you! However, and I should have this in my original question, the individual rows are not display any percent in a bar graph view. I would like to see each issue show the percent value that is being calculated. Is that possible?
Hi @swoodward,
You can’t have two different numeric formats for a numeric value in one measure. In the suggested formula, the individual issue percentages are converted to a string to look like percentages - that is why the bar chart view is empty for individual issues.
As a workaround, create two calculated measures. One with the following formula:
CASE WHEN [Issue].CurrentMember.Level.Name = "Issue"
THEN
  CASE WHEN
    [Measures].[Issues created] > 0
  THEN
      CASE [Status].CurrentHierarchyMember.Name
      WHEN "Blocked" THEN 0.1
      WHEN "In Progress" THEN 0.2
      WHEN "Done" THEN 1
      END
  END
END
Use one of the percentage formatting options for the calculated measure - Calculated measures .
Create another calculated measure with the formula below:
CASE WHEN [Issue].CurrentHierarchyMember.Level.Name <> 'Issue'
THEN [Measures].[Issues created]
END
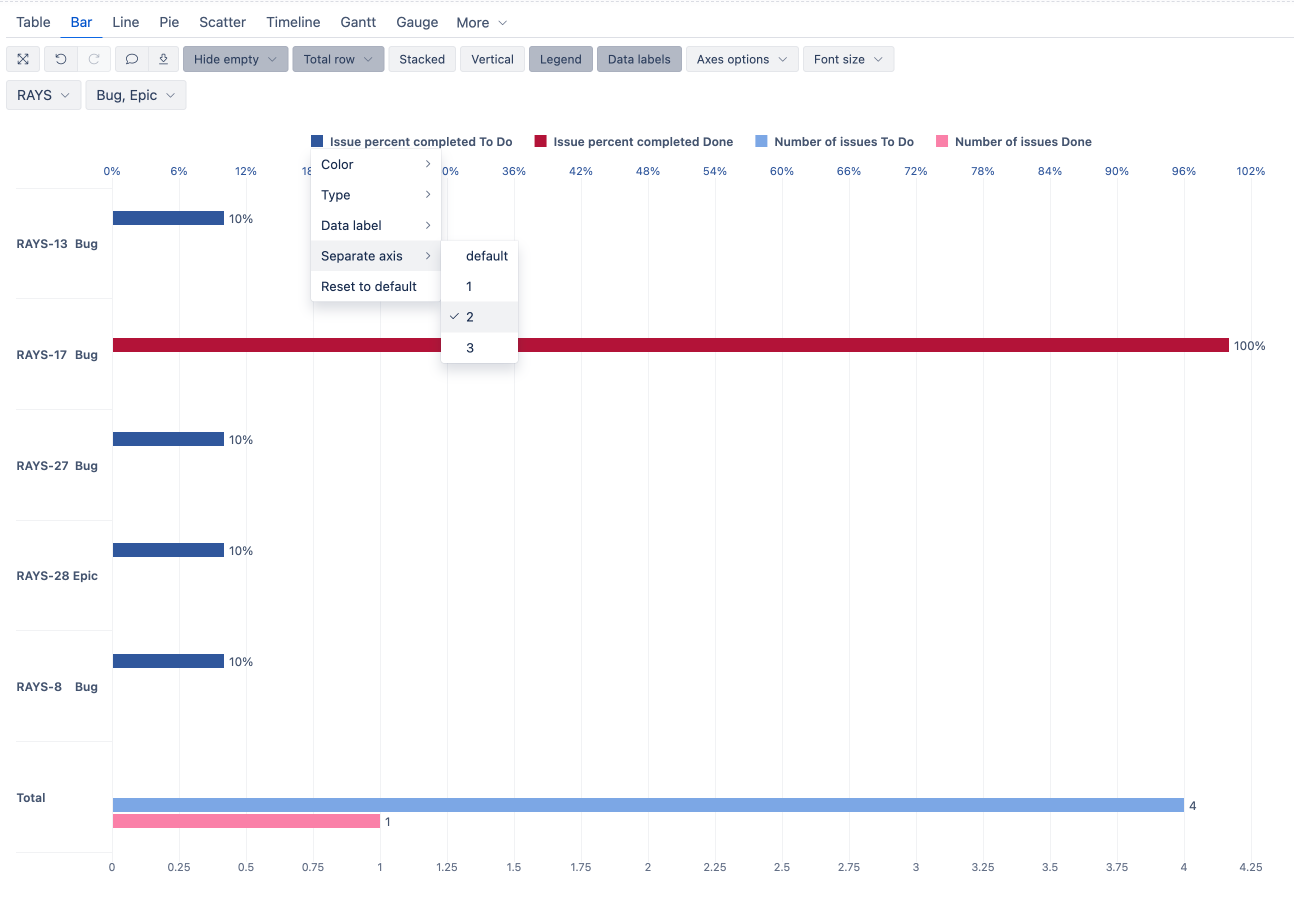
Select both measures, switch to the bar chart view, and change the axis for the percentage values - Customize chart.
The report could look similar to the one below:
Best,
Roberts // support@eazybi.com