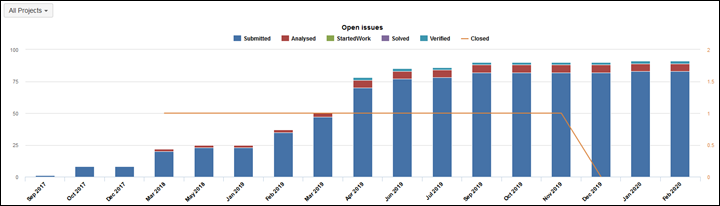
I created a report which shows the number of open issues by status through time. However I noticed that not all month are on the abscissa axis (only two months for year 2018 for instance) as it is shown on the following picture:
I thought it was because I did not have enough data for the missing months but when I changed my report from a bar to a timeline, I had a completely different abscissa axis with new months showing up and disappearing.
I am still trying to understand how eazyBI determines which months should be on the report and what is the use of the “nonempty” button because It does not changed much on my report.
Moreover, by scanning the web, I learned it was possible to add manually the missing months but I was wondering if there is another way to do it because it is not a sustainable solution.
Frankly speaking, I do not know any other reporting tool when the timeline is not completely displayed on time-based graphs and typically JIRA handles it very well for any time-based graph (ex : ‘Created vs Resolved Chart’).
We are currently experimenting eazyBI for potential deployment and this weakness, if confirmed, could clearly be a show-stopper.
By default, eazyBI is adding members to Time dimension only if there is some activity on that date. Future dates often are not added as the only action that usually is in future is the Issue due dates or Sprint end date. In some cases, some past dates could be missing due to the lack of activity per day. You can fill in any gaps in time by adding time members.
However, you may want to check a set of imported issues. It might have some gaps in creation dates and activities performed on them. It might happen in cases when you are using JQL query in import options to filter out older closed issues for import or you have some inactivity period in your project in Jira. For this report, you would like to make sure, all issues relevant to previous periods are imported.
Nonempty option is important for any report when you would like to hide emtpy rows. This option will hide any rows with no related measures.
Here is one more tip. Measure Open issues represent unresolved issues at any period based on issues created date and issue resolution date. The measure might give you inconsistent results when used with status dimension. Status dimension will always represent the current status and will exclude any resolved issues from Open issues calculation. Therefore, you might get inconsistent results when you are using Open issues with Status dimension over Time.
If you would like to analyse how many issues were in a particular status at any given period back in time, I would suggest using dimension Transition status and measure Issues history. This dimension and measure represent historical data of issues.